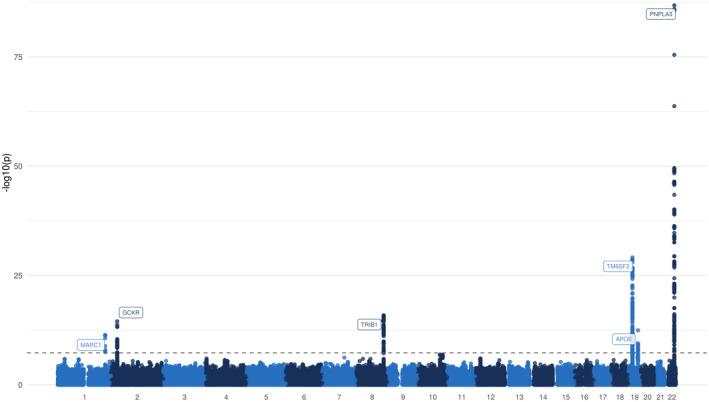
FIG. 2.

Manhattan plot for the association with NAFLD (4,761 cases and 373,227 controls). Each variant is plotted based on chromosome and position on the x‐axis and ‐log10 P values on the y‐axis. The horizontal dotted line represents genome‐wide significance (P = 5*10−8).
