Figure 1.
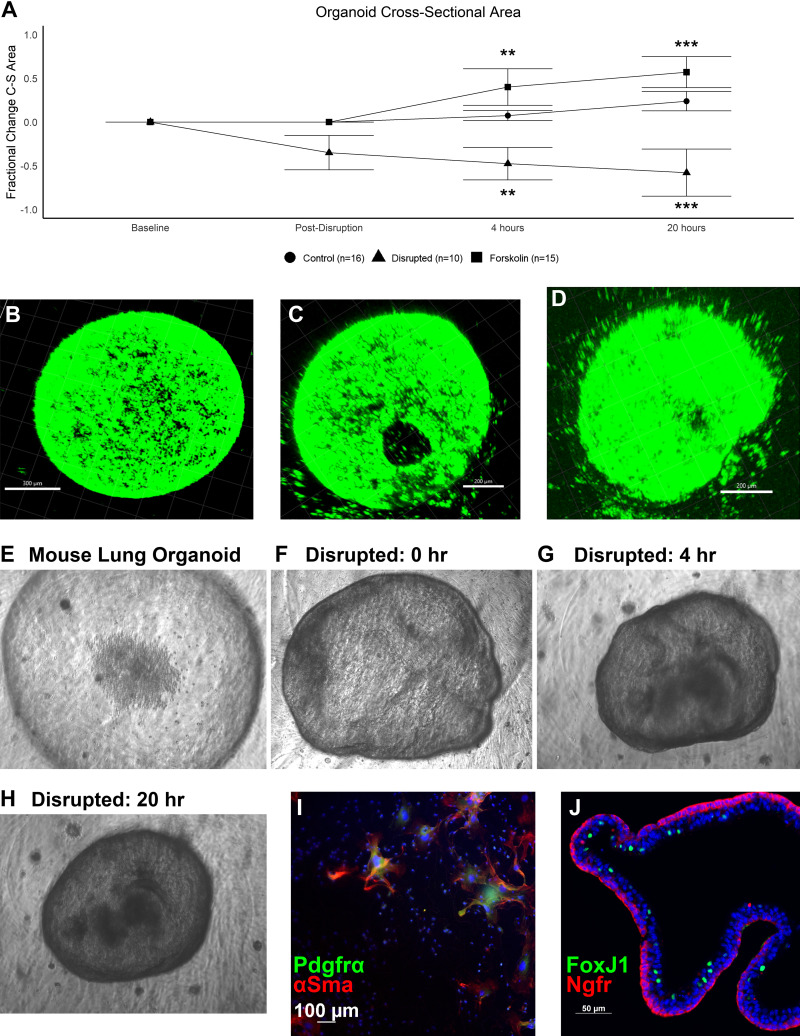
Mouse lung organoid (mLO) forskolin and disruption models. A: fractional change of mLO cross-sectional area at 0, 4, and 20 h after exposure to forskolin (n = 15) or after disruption (n = 10) compared with control (n = 16). Center bar represents median and whiskers 25th and 75th percentile. Kruskal–Wallis test at 4 and 20 h; P < 0.001. Statistical comparisons by Dunn’s post hoc test vs. control are shown with **P < 0.01 and ***P < 0.001. Membrane-stained mLO before (B), immediately after (C), and 20 h after disruption (D). Scale bars = 200 µm. E: representative phase contrast image of an mLO. Representative image of the same mLO immediately after disruption (F), 4 h after disruption (G), and 20 h after disruption (H). I: adherent cells were cultured for 1 wk for characterization showing both α-smooth muscle actin (αSMA) and platelet-derived growth factor receptor-α (PDGFR-α)-positive cells which formed syncytia over time. Negative and low-expressing cells were also observed. J: mLOs expressed proximal airway markers such as the basal cell marker nerve growth factor receptor (NGFR, red) and scattered ciliated cells marked by nuclear FoxJ1 (green). Scale bar = 50 µm. C-S area, cross-sectional area.

