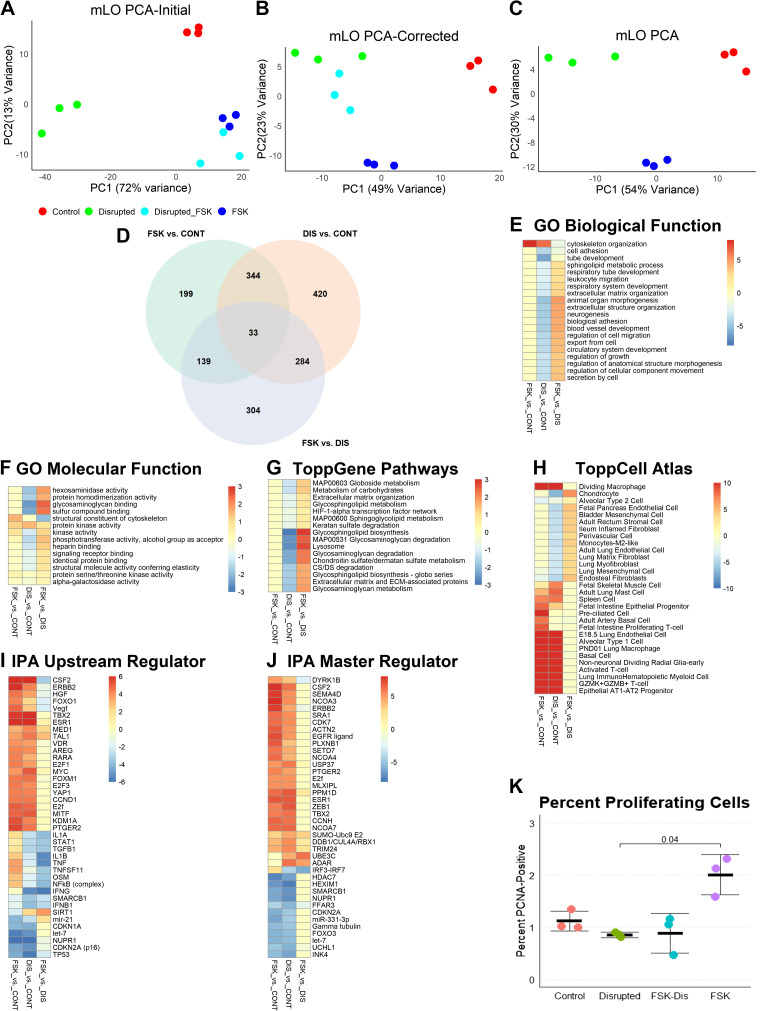
Figure 2.
Analysis of mLOs in forskolin and disruption model. A: both forskolin (FSK) and disrupted (DIS) mLOs (n = 3 per group; each specimen represents one well of treated organoids) exposed to FSK (Disrupted_FSK) had similarities in gene expression that were due to FSK and not mechanosensing. This similarity is visualized by the close clustering of these samples by principal component analysis (PCA). PC1, Principal Component 1; PC2, Principal Component 2. For each group, n = 3. B: to remove this effect, genes with a twofold change in expression between DIS and DIS/FSK were removed from analysis. After removal, FSK/DIS mLO gene expression profile was more like DIS than FSK or control. C: gene set enrichment analysis (GSEA) was performed on the 3 control, 3 FSK, and 3 DIS organoid mRNA-seq data sets using ToppGene. D: Venn diagram with number of differentially expressed genes for each comparison. E: comparison of gene ontogeny (GO) biological functions revealed greater upregulation of cytoskeleton-related functions in FSK compared with DIS and downregulation of many developmental processes in DIS, such as tube development and cell adhesion. Color scale represents −log10 Bonferroni-corrected P values for upregulated processes and log10 values for downregulated ones. A threshold of corrected P value of 0.1 was applied (i.e., values in this range are yellow). F: analysis of GO molecular functions showed upregulation of cytoskeleton-related functions in FSK and downregulation of processes related to extracellular matrix binding in DIS. G: pathway analysis showed no significant changes in FSK compared with control and downregulation of many processes related to cell-matrix interaction and lipid metabolism. H: to determine if any cell-specific gene sets were enriched, the 3 gene sets were compared with the ToppCell Atlas that computes a Bonferroni-corrected P value for each set compared with published single-cell mRNA-seq data sets. Both FSK and DIS had increased expression of genes found in inflammatory, basal, and AT2-AT1 progenitor cells. DIS had reduced abundances of mRNAs found in chondrocytes, and various lung lineage mesenchymal cells. I: ingenuity pathway analysis (IPA) found stronger activation of many upstream regulators in FSK compared with DIS with most of these regulators being involved in inflammation and cell cycle. Differences in FSK and DIS were noted in NFκB-related inflammation and TGF-β. Upregulation of the histone deacetylase sirtuin 1 (SIRT1) in DIS with downregulation in FSK suggests that changes in chromatin state may account for some of the differences between FSK and DIS. Color scale represents the IPA activation score with positive being activated and negative being inhibited. A threshold of 1 is applied. J: regulatory element depth analysis in IPA identified some of the same regulators as upstream analysis with additional identification of posttranslational modifications such as ubiquitination and sumoylation as being different between FSK and DIS and interferon response factors as accounting for the difference in inflammatory signaling. K: by flow cytometry, FSK organoids had significantly more proliferating cells than control, DIS, or FSK/DIS organoids. n = 3 per group, Kruskal–Wallis P = 0.01, Dunn’s post hoc test P value is shown. CONT, control; mLO, mouse lung organoid; PCNA, proliferating cell nuclear antigen; TGF-β, transforming growth factor-β.

