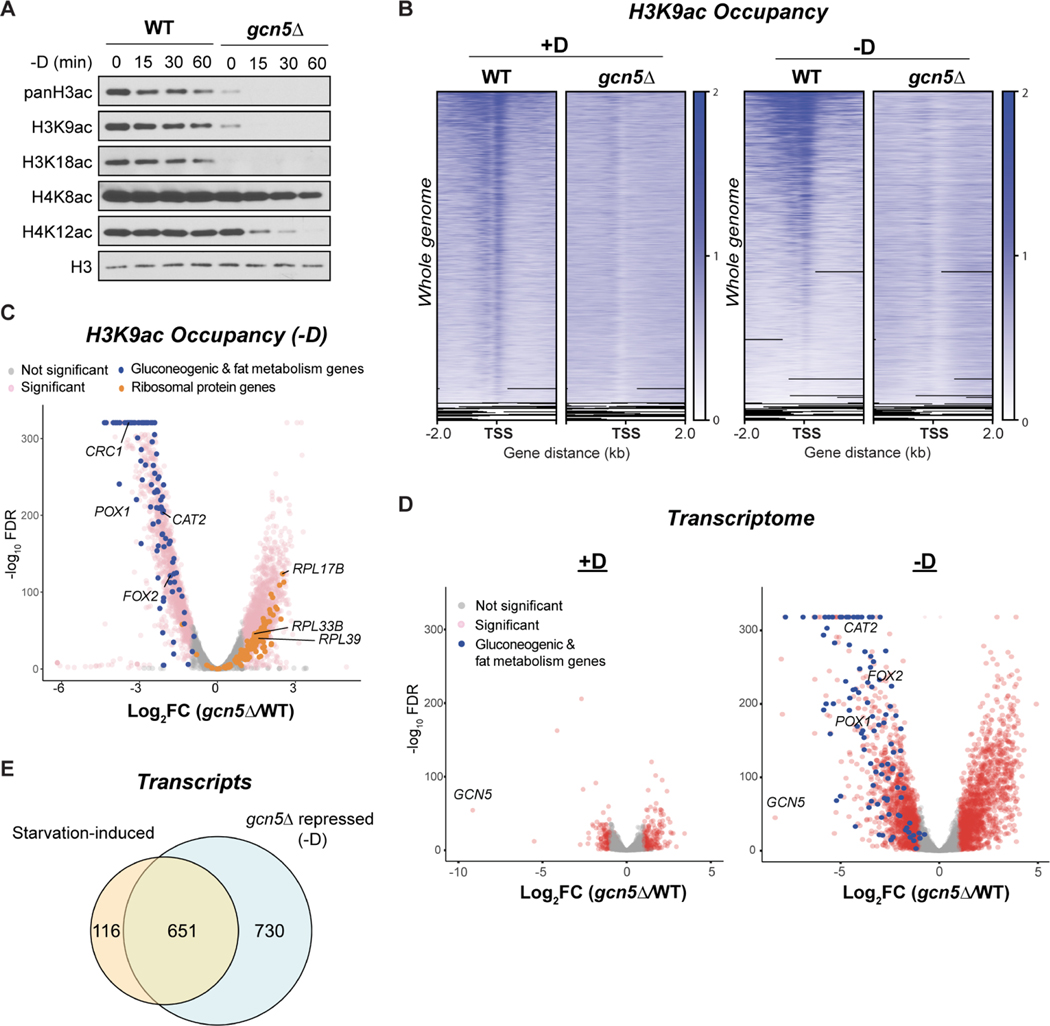
Figure 4. gcn5Δ cells lose H3 acetylation and exhibit impaired induction of gluconeogenic and fat metabolism genes upon glucose starvation.
(A) Immunoblots of bulk histone acetylation in WT and gcn5Δ cells following glucose starvation. Note that gcn5Δ cells exhibited a delayed loss in H4 acetylation, which could be due to cooperative interactions with other H4 HATs (Li and Shogren-Knaak, 2009).
(B) ChIP-seq data displaying genomic occupancy of H3K9ac in WT and gcn5Δ cells in glucose-replete (+D) or glucose starvation (−D) conditions. For each condition, genes were ranked in the order of decreasing signals in WT cells. Genes shown in rows are the same between WT and gcn5Δ cells.
(C) Volcano plot of ChIP-seq data showing the differential occupancy of H3K9ac in gcn5Δ cells compared to WT cells. Thresholds of 2-FC and 0.05 FDR were considered significant. Gluconeogenic and fat metabolism genes are colored blue. Ribosomal protein genes are colored orange.
(D) Volcano plot of RNA-seq data showing differential gene expression in gcn5Δ cells compared to WT cells in glucose-replete (+D) or glucose starvation (−D) conditions. Thresholds of 2-FC and 0.05 FDR were considered significant. Gluconeogenic and fat metabolism genes are colored in blue.
(E) Venn diagrams showing the numbers of genes induced by glucose starvation in WT cells (starvation-induced transcripts) or repressed in gcn5Δ cells under glucose starvation.

