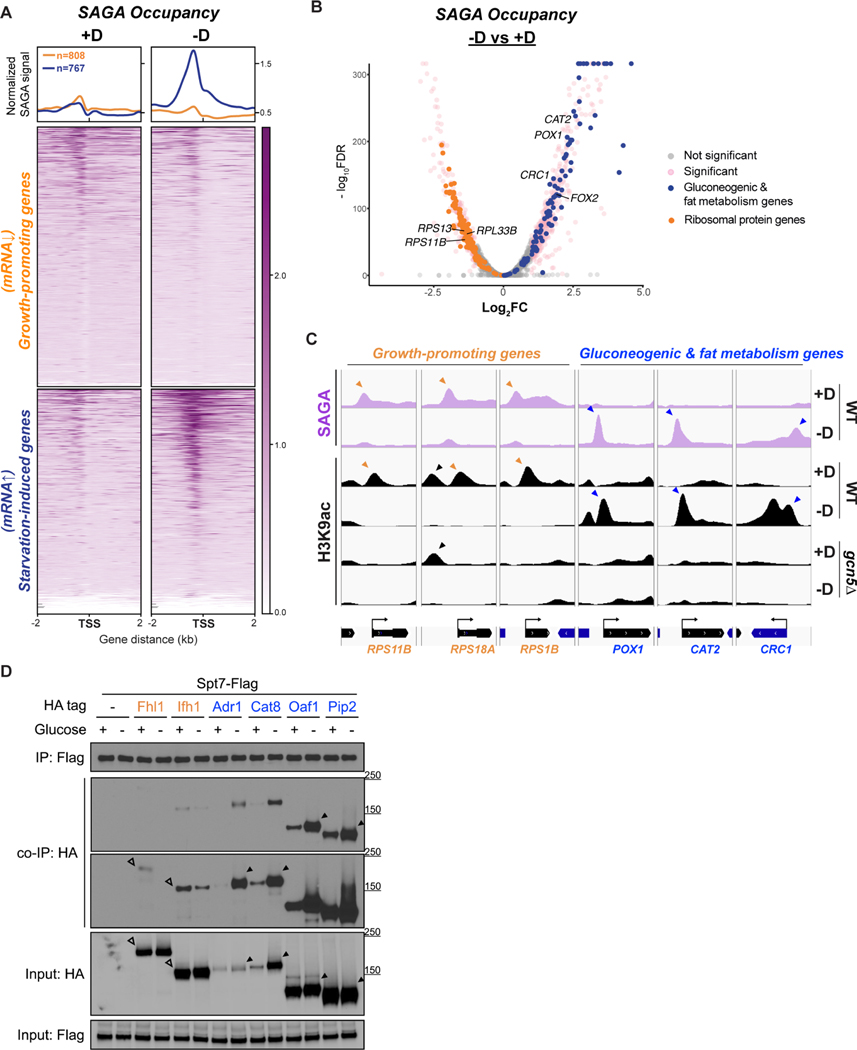
Figure 5. SAGA binds to different groups of genes and transcription factors depending on glucose availability.
(A) ChIP-seq data displaying SAGA occupancy (assessed by Gcn5p-HA) at two subsets of genes upon glucose starvation. Metagene profile shows the average signal of SAGA binding at either subset: growth-promoting genes in orange; starvation-induced genes in blue. Growth-promoting genes in heatmaps were ranked by signal intensity from glucose-replete condition (+D), while starvation-induced genes were ranked by signal intensity from glucose starvation (−D).Genes shown in rows are the same between two conditions.
(B) Volcano plot of SAGA ChIP-seq depicting the differential binding of SAGA in cells upon glucose starvation. Thresholds of 2-FC and 0.05 FDR were considered significant. Ribosomal protein genes are colored in orange. Gluconeogenic and fat metabolism genes are colored in blue.
(C) Genome browser view showing co-occupancy of SAGA and H3K9ac at growth-promoting genes (orange) or gluconeogenic and fat metabolism genes (blue). Orange and blue arrowheads indicate the peaks of H3K9ac that reside at the TSS of the genes of interest. Black arrowhead indicates an H3K9ac peak independent of Gcn5p/SAGA.
(D) Interaction of SAGA with different transcription factors (TFs) in glucose-replete (+D) or glucose-starvation conditions (−D). Endogenously Flag-tagged Spt7p was used to immunoprecipitate the SAGA complex. Co-immunoprecipitation of HA-tagged TFs were detected by immunoblotting. Empty arrowheads indicate the interaction between SAGA and growth-specific TFs (orange). Solid arrowheads indicate the interaction between SAGA and starvation-specific TFs (blue).

