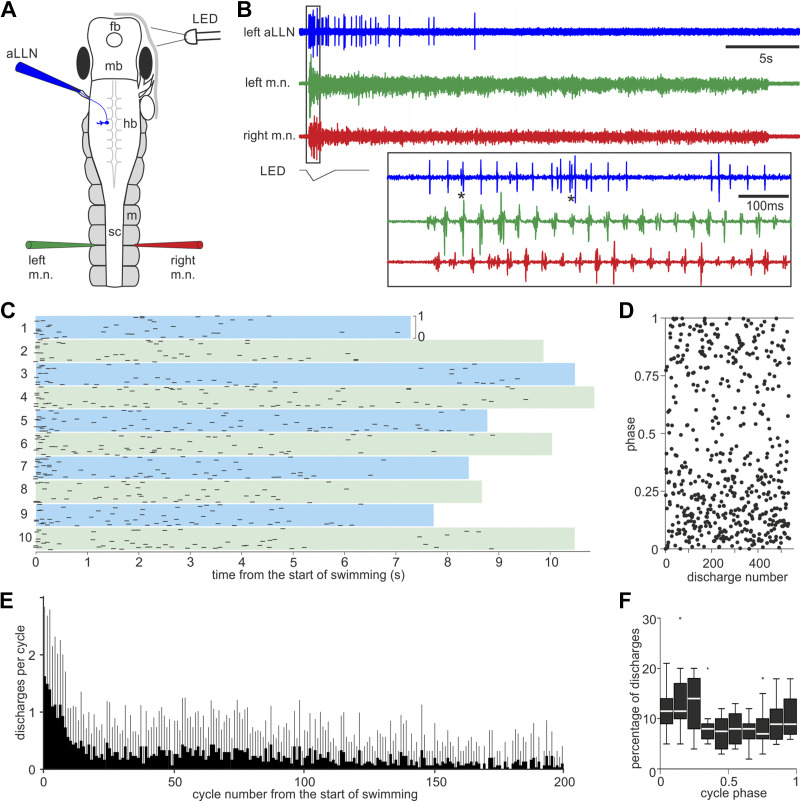
Figure 7.
Anterior lateral line nerve (aLLN) efferent activities. A: setup for recording the aLLN efferent activity where fictive swimming is started by dimming an LED light. fb, forebrain; hb, hindbrain; m, myotome; mb, midbrain; sc, spinal cord. B: an example of aLLN efferent recording during a fictive swimming episode. The box region is expanded below to show the timing of the efferent activity relative to motor nerve (m.n.) bursts on both sides. *Examples of multiple unitary discharges within a single swimming cycle. C: raster plot of unitary aLLN efferent discharge phases in 10 swimming episodes from one tadpole. Top and bottom borders of color bands indicate phase from 0 to 1 as marked in episode 1. Color band length indicates episode duration. D: pooled phase plot of all 525 unitary discharges in C. E: number of unitary discharges per swimming cycle in the first 200 cycles after fictive swimming is started (averaged from 3 episodes from each of 10 tadpoles). Gray bars are SD. F: normalized distribution of the phases of aLLN unitary discharges calculated relative to their immediate fictive swimming cycles, defined by the m.n. bursts on the ipsilateral side at the 5th muscle cleft (100 spikes from each of 10 tadpoles, longitudinal time delays not calibrated). Peak phase is 0.11 (Z of Rayleigh statistic is 22.6, P < 0.001).

