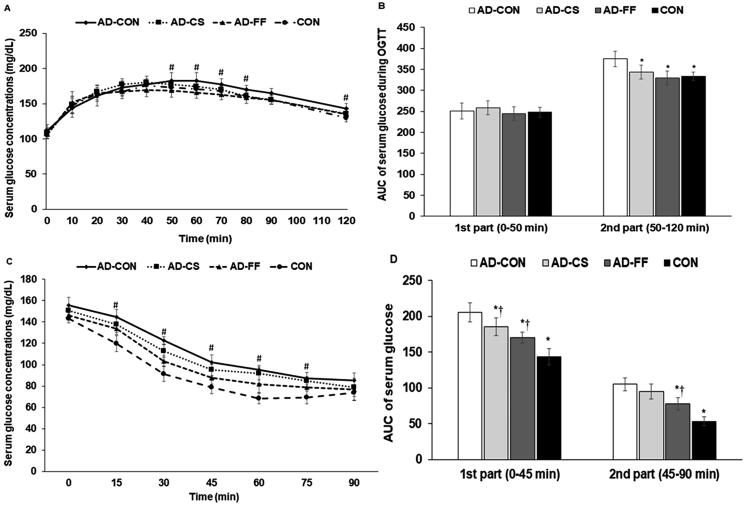
Figure 3.
Changes in serum glucose and insulin concentrations and areas under the curve during oral glucose tolerance testing (OGTT) and intraperitoneal insulin tolerance testing (IPITT). Amyloid-β(25–35) infused rats were fed a high-fat diet containing dextrin (AD-CON group), the water extract of Cassiae Semen (AD-CS group), or the water extract of Forsythiae Fructus (AD-FF) for 49 days. Amyloid-β(35–25) infused rats were fed a high-fat diet containing dextrin (CON group). (A) Changes in serum glucose concentration measured after oral consumption of 2 g glucose/kg body weight (OGTT) after overnight fasting at the fifth week. (B) The area under the curve (AUC) of serum glucose concentration changes during the 1st (0–50 min) and second parts (50–120 min) of OGTT. (C) Changes in serum glucose concentration measured after intraperitoneal injection of 1 IU insulin/kg body weight (IPITT) after 6 h food deprivation at 3 days after OGTT. (D) The area under the curve of serum glucose concentration changes during the 1st (0–30 min) and second parts (30–90 min) of IPITT. Bars and error bars represent the means ± standard deviations (n = 10). # Significantly different among the groups by one-way ANOVA at p < 0.05. *Significantly different from the AD-CON by Tukey test at p < 0.05. †Significantly different from the CON by Tukey test at p < 0.05.

