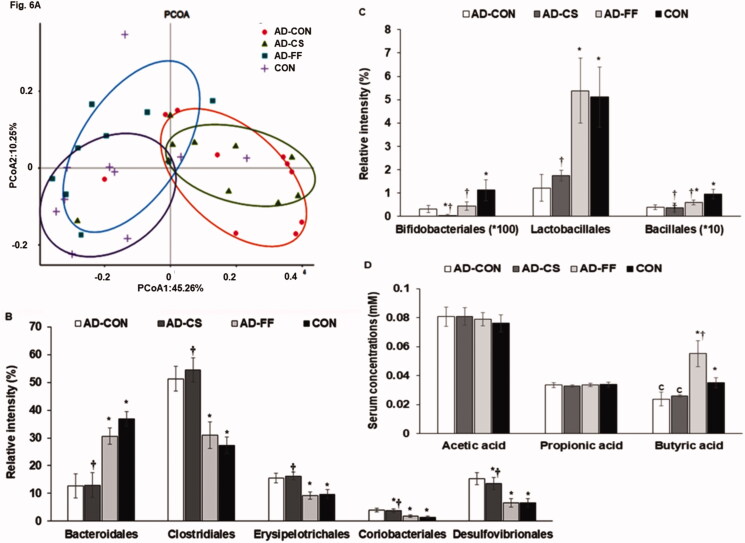
Figure 6.
Gut microbiome profiles. Faeces were collected from the caeca at the end of the experiment, and bacterial DNA was analysed using the NGS method. Amyloid-β(25–35) infused rats were fed a high-fat diet containing dextrin (AD-CON group), water extract of Cassiae Semen (AD-CS group), or water extract of Forsythiae Fructus (AD-FF group) for 49 days. Amyloid-β(35–25) infused rats were fed a high-fat diet containing dextrin (CON group). The microbiome of faeces in the caecum was measured by the NGS method at the end of the study. Short-chain fatty acid (SCFA) concentrations in the serum from the portal vein were measured by gas chromatography. (A) Principal coordinate analysis (PCoA) of faecal bacteria. (B) Relative amounts (%) of Bacteriodales, Clostridales, and Erysipelotrichales in faecal samples. (C) Relative amounts (%) of Lactobacillales, Desulfovibrionales, and Enterobacteriales in faecal samples. (D) Serum concentrations of SCFA as determined by gas chromatography. Bars and error bars represent the means ± standard deviations (n = 10). *Significantly different from the AD-CON by Tukey test at p < 0.05. †Significantly different from the CON by Tukey test at p < 0.05.

