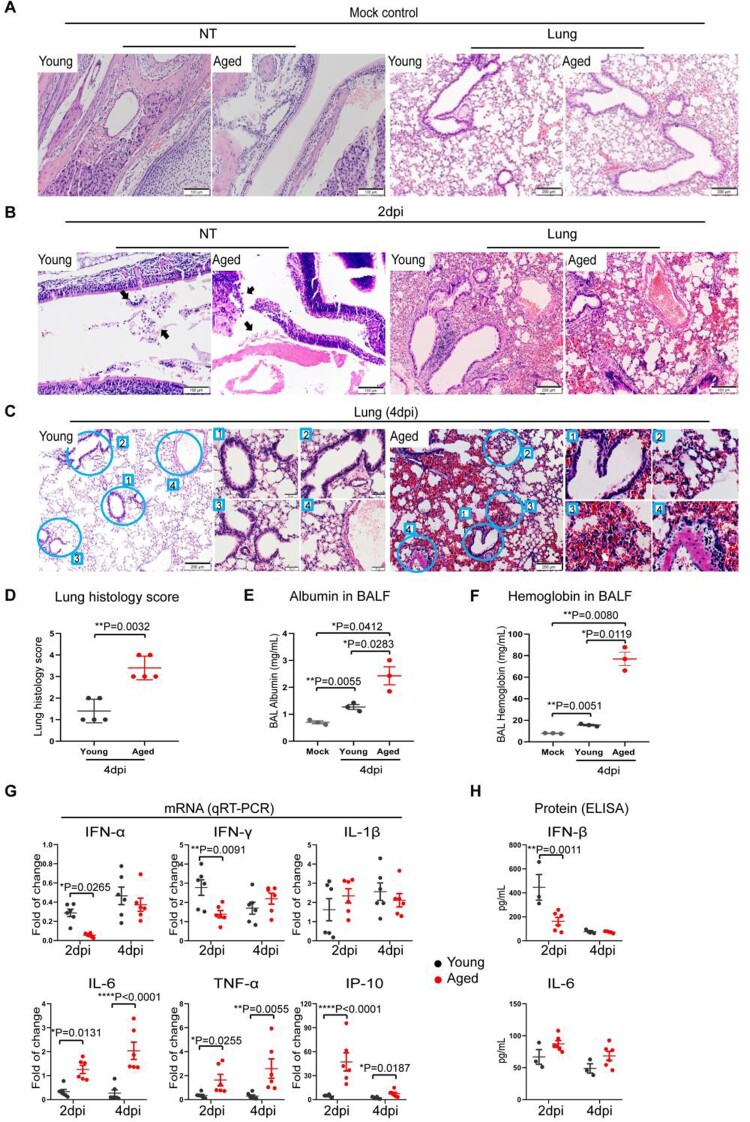
Figure 2.
SARS-CoV-2 B.1.1.7 virus-infected and caused severe inflammatory damage to respiratory tissues in aged mice. A group of young and aged mice was inoculated with 103PFUs of B.1.1.7 virus via the intranasal route. Tissue samples were collected and analysed at 2 and 4 days post-infection. Formalin-fixed and paraffin-embedded mouse nasal turbinate (NT) and lung tissue sections were stained by haematoxylin and eosin for histological examination. (A) H&E images showed NT and lung sections of mock infection controls of young and aged mice. (B) Representative images of NT section (left panels) and lung sections (right panels) of mice at 2 dpi. Solid arrows indicated nasal epithelium destructed and detached into the nasal cavity of mice. On the right shown representative H&E images of lung tissues. The lung of the young mouse showed peribronchiolar and perivascular immune cell infiltration and alveolar wall congestion. The lung of the aged mouse showed bronchiolar epithelium desquamation and endothelium infiltration in the blood vessel. (C) Representative H&E images lung sections at 4 dpi. The lower magnification images showed only mild alveolar wall thickening in the young mouse, while the lung of aged mice showed a large area of alveolar haemorrhage. The circled areas were magnified, showing (1) bronchiolar epithelial cell detachment and luminal cell debris, (2) alveolar space exudation, (3) alveolar space haemorrhage and (4) vasculature infiltration. All these features of inflammatory tissue damage were obvious in aged mice compared to young mice. Scale bars = 200 µm. (D) Scores for histopathological damage in the lung sections at 4 dpi. H&E stained mouse lung tissue sections were evaluated for the severity of bronchiolitis, alveolitis and vasculitis by the histopathologist. Data represent mean ± SD. n = 3–5 for each group. **P < 0.01 by student t-test. (E and F) ELISA assay determined the concentration of albumin (E) or haemoglobin (F) in the bronchiolar lavage fluid taken from infected mice taken at 4 dpi. Data represent mean ± SD. n = 3 for each group. *P < 0.05, **P < 0.01 by one-way ANOVA. (G) Inflammatory cytokine and chemokine in homogenized lung tissues of aged and young mice at 2 or 4 dpi. Relative mRNA expression levels of the cytokines were determined by qRT-PCR with gene-specific primers. House-keeping gene β-actin was included for the normalization of RNA concentration in each sample. (H) The protein concentrations for IFN-β and IL-6 were determined by ELISA. Data represent mean ± SD. n = 3–6 for each group. *P < 0.05, **P < 0.01, ***P < 0.001, ****P < 0.0001 by two-way ANOVA.

