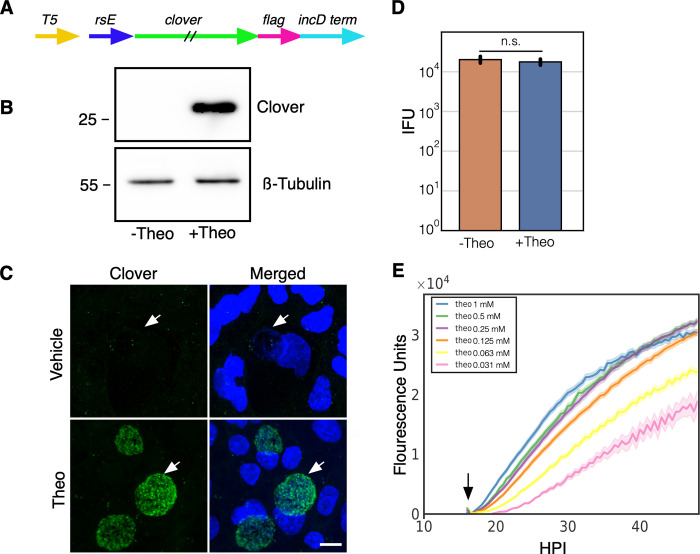
Fig 1. Characterization of p2TK2-SW2-T5-E-clover-flag.
A) Schematic of the E-clover expression construct consisting of the T5-lac promoter (T5), riboE riboswitch (rsE) and the ORF for the clover fluorescent protein with an inframe 3x flag tag. B) Anti-flag western blot of Cos-7 cells infected with L2-T5-E-clover-flag comparing expression of theophylline treated and untreated cultures. Cells were induced or not with 0.5 mM theophylline at 16 hpi and proteins were harvested at 30 hpi. A ß-tubulin I western blot served as a sample loading control. C) Confocal micrographs of Cos-7 cells infected with L2-T5-E-clover-flag and induced or not with 0.5 mM theophylline at 16 hpi and fixed and stained with DAPI for microscopy at 30 hpi. DAPI (blue), Clover (green). Arrow indicates the position of the chlamydial inclusion. Size bar = 10 μm. D) Cos-7 cells were infected with L2-T5-E-clover-flag and the production of infectious progeny was determined at 48 hpi after 0.5 mM theophylline induction or vehicle only. E) Cos-7 cells were infected with L2-T5-E-clover-flag, treated with varying dilutions of theophylline at 16 hpi (1 mM, 0.5 mM, 0.25 mM, 0.125 mM, 0.0625 mM, 0.03125mM) and imaged for 50 hours using live cell imaging. The Clover expression intensities from >50 individual inclusions were monitored via automated live-cell fluorescence microscopy and average intensities were plotted. Live cell imaging demonstrated that Clover induction was dose responsive. Cloud represents SEM. Y-axes are denoted in scientific notation. Error bars = SEM. n. s. denotes p-values > 0.05.

