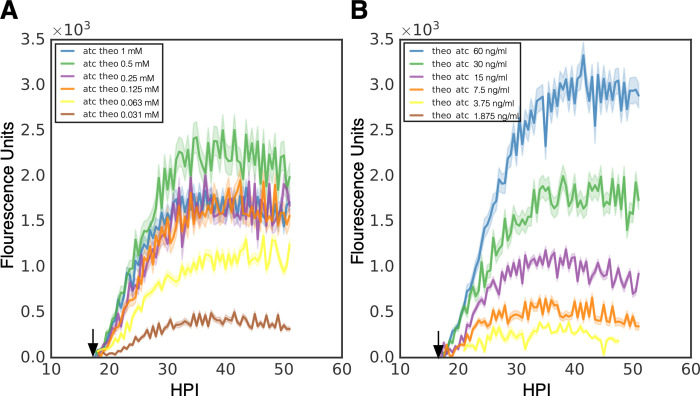
Fig 4. Induction kinetics of p2TK2-SW2-Tet-J-E-clover-flag.
A) Cos-7 cells were infected with L2-Tet-J-E-clover-flag, treated with varying dilutions of theophylline at 16 hpi (1 mM, 0.5 mM, 0.25 mM, 0.125 mM, 0.0625 mM, 0.03125mM) and 30 ng/ml aTc at 0 hpi. The infections were monitored using live cell imaging for 50 hours. B) Cos-7 cells were infected with L2-Tet-riboJ-E-clover-flag, treated with varying dilutions of aTc at 16 hpi (60 ng/ml, 30 ng/ml, 15 ng/ml, 7.5 ng/ml, 3.75 ng/m, 1.875 ng/m) and 0.5 mM theophylline at 0 hpi. The infections were monitored using live cell imaging for 50 hours. Expression intensities from >50 individual inclusions were monitored via automated live-cell fluorescence microscopy and the mean intensities are shown. Cloud represents SEM. Y-axes are denoted in scientific notation.

