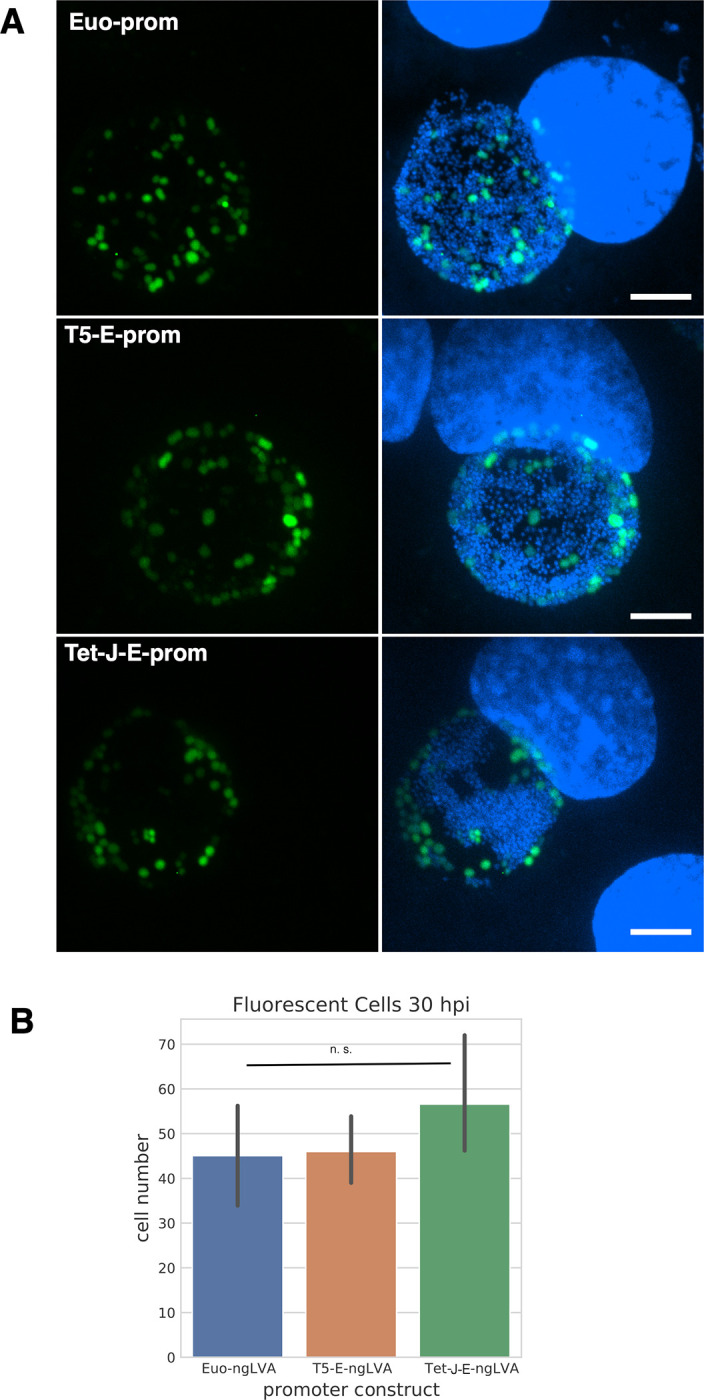
Fig 6. Promoter cell type expression.

A) Confocal micrographs of Cos-7 cells infected with L2-euo-neogreenLVA (euo-ngLVA), L2-T5-E-neogreenLVA (T5-E-ngLVA), or L2-Tet-J-E-neogreenLVA (Tet-E-ngLVA) (green) and fixed and stained with DAPI (blue) at 30 hpi. Size bar = 10 μm. B) Quantification of > 20 neongreenLVA expressing chlamydial cells for each promoter construct. Error bars = SEM. n. s. denotes p-values > 0.05.
