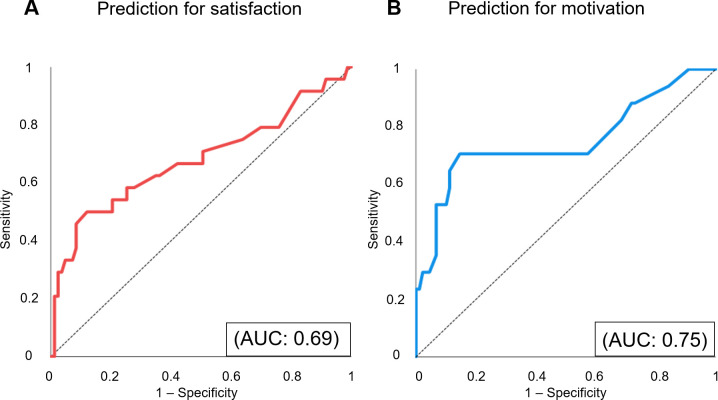
Fig 2. The prediction models’ accuracy for satisfaction and motivation.
We applied the scoring prediction model developed using the derivation dataset to the validation dataset. Based on the model’s prediction performance in the validation dataset, we created receiver operating characteristic (ROC) curves for satisfaction and motivation. (A) A given ROC curve delineates predictive accuracy for satisfaction. (B) A given ROC curve delineates predictive accuracy for motivation. AUC: area under the curve.

