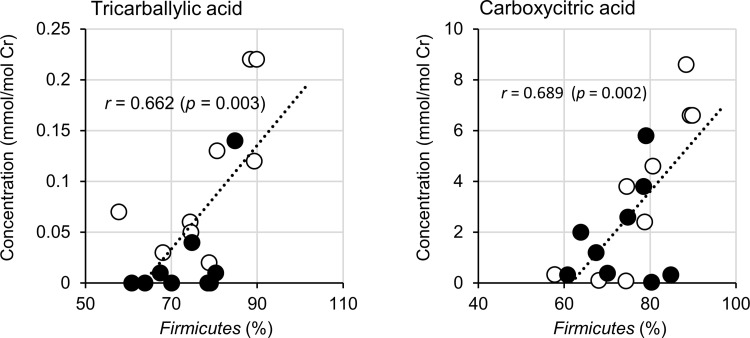
Fig 5. Correlations between urinary metabolites and bacterial composition at the phylum level.
Phylum Firmicutes versus tricarballylic acid (A) and carboxylic acid (B). Open and closed circles represent values in the pre-observation period (PRE) and LEX-ingestion period (POST), respectively. Pearson’s correlation coefficients (r) are shown for each plot with p-values. The analysis was conducted using data from 18 points from two samples given by nine participants.

