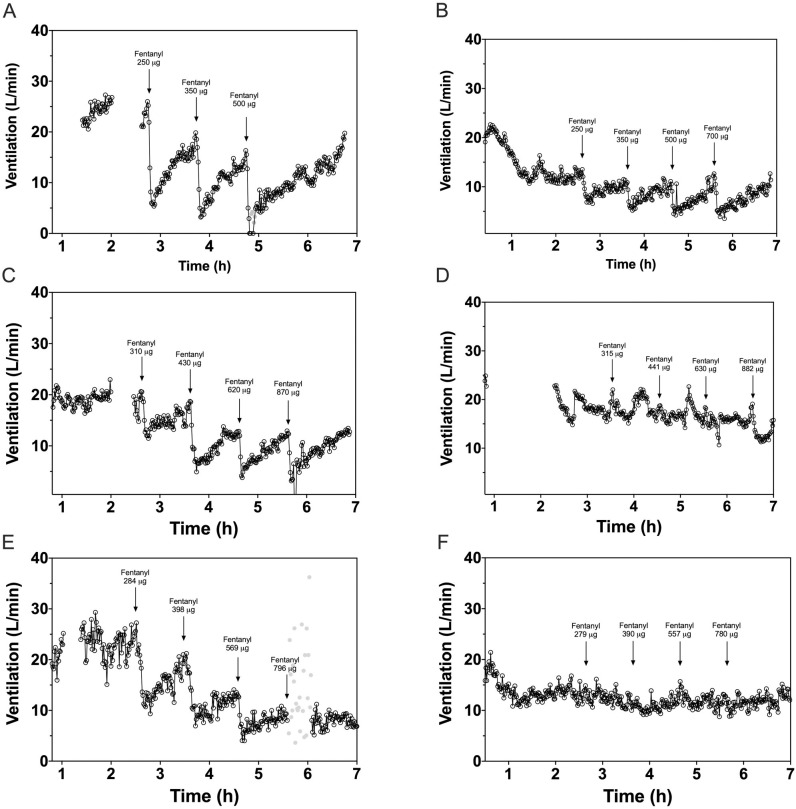
Fig 4. Example graphs showing the effect of fentanyl on minute ventilation in three opioid-tolerant patients during placebo infusion and buprenorphine infusion.
(1) Placebo infusion (A, C and E) and buprenorphine infusion (B, D, F) at target plasma concentrations of 1 ng/mL (top row), 2 ng/mL (middle row) and 5 ng/mL (lower row). (2) Open spaces in the beginning of graphs A, C, D and E relate to concurrent clinical events such as temporary removal of the facemask. (3) Grey dots are stimulated breaths in case of an apnea episode. (4) The time on the x-axis in the graphs is related to the start time of the ventilation experiment, not the timing of the buprenorphine/placebo infusion and fentanyl injections.

