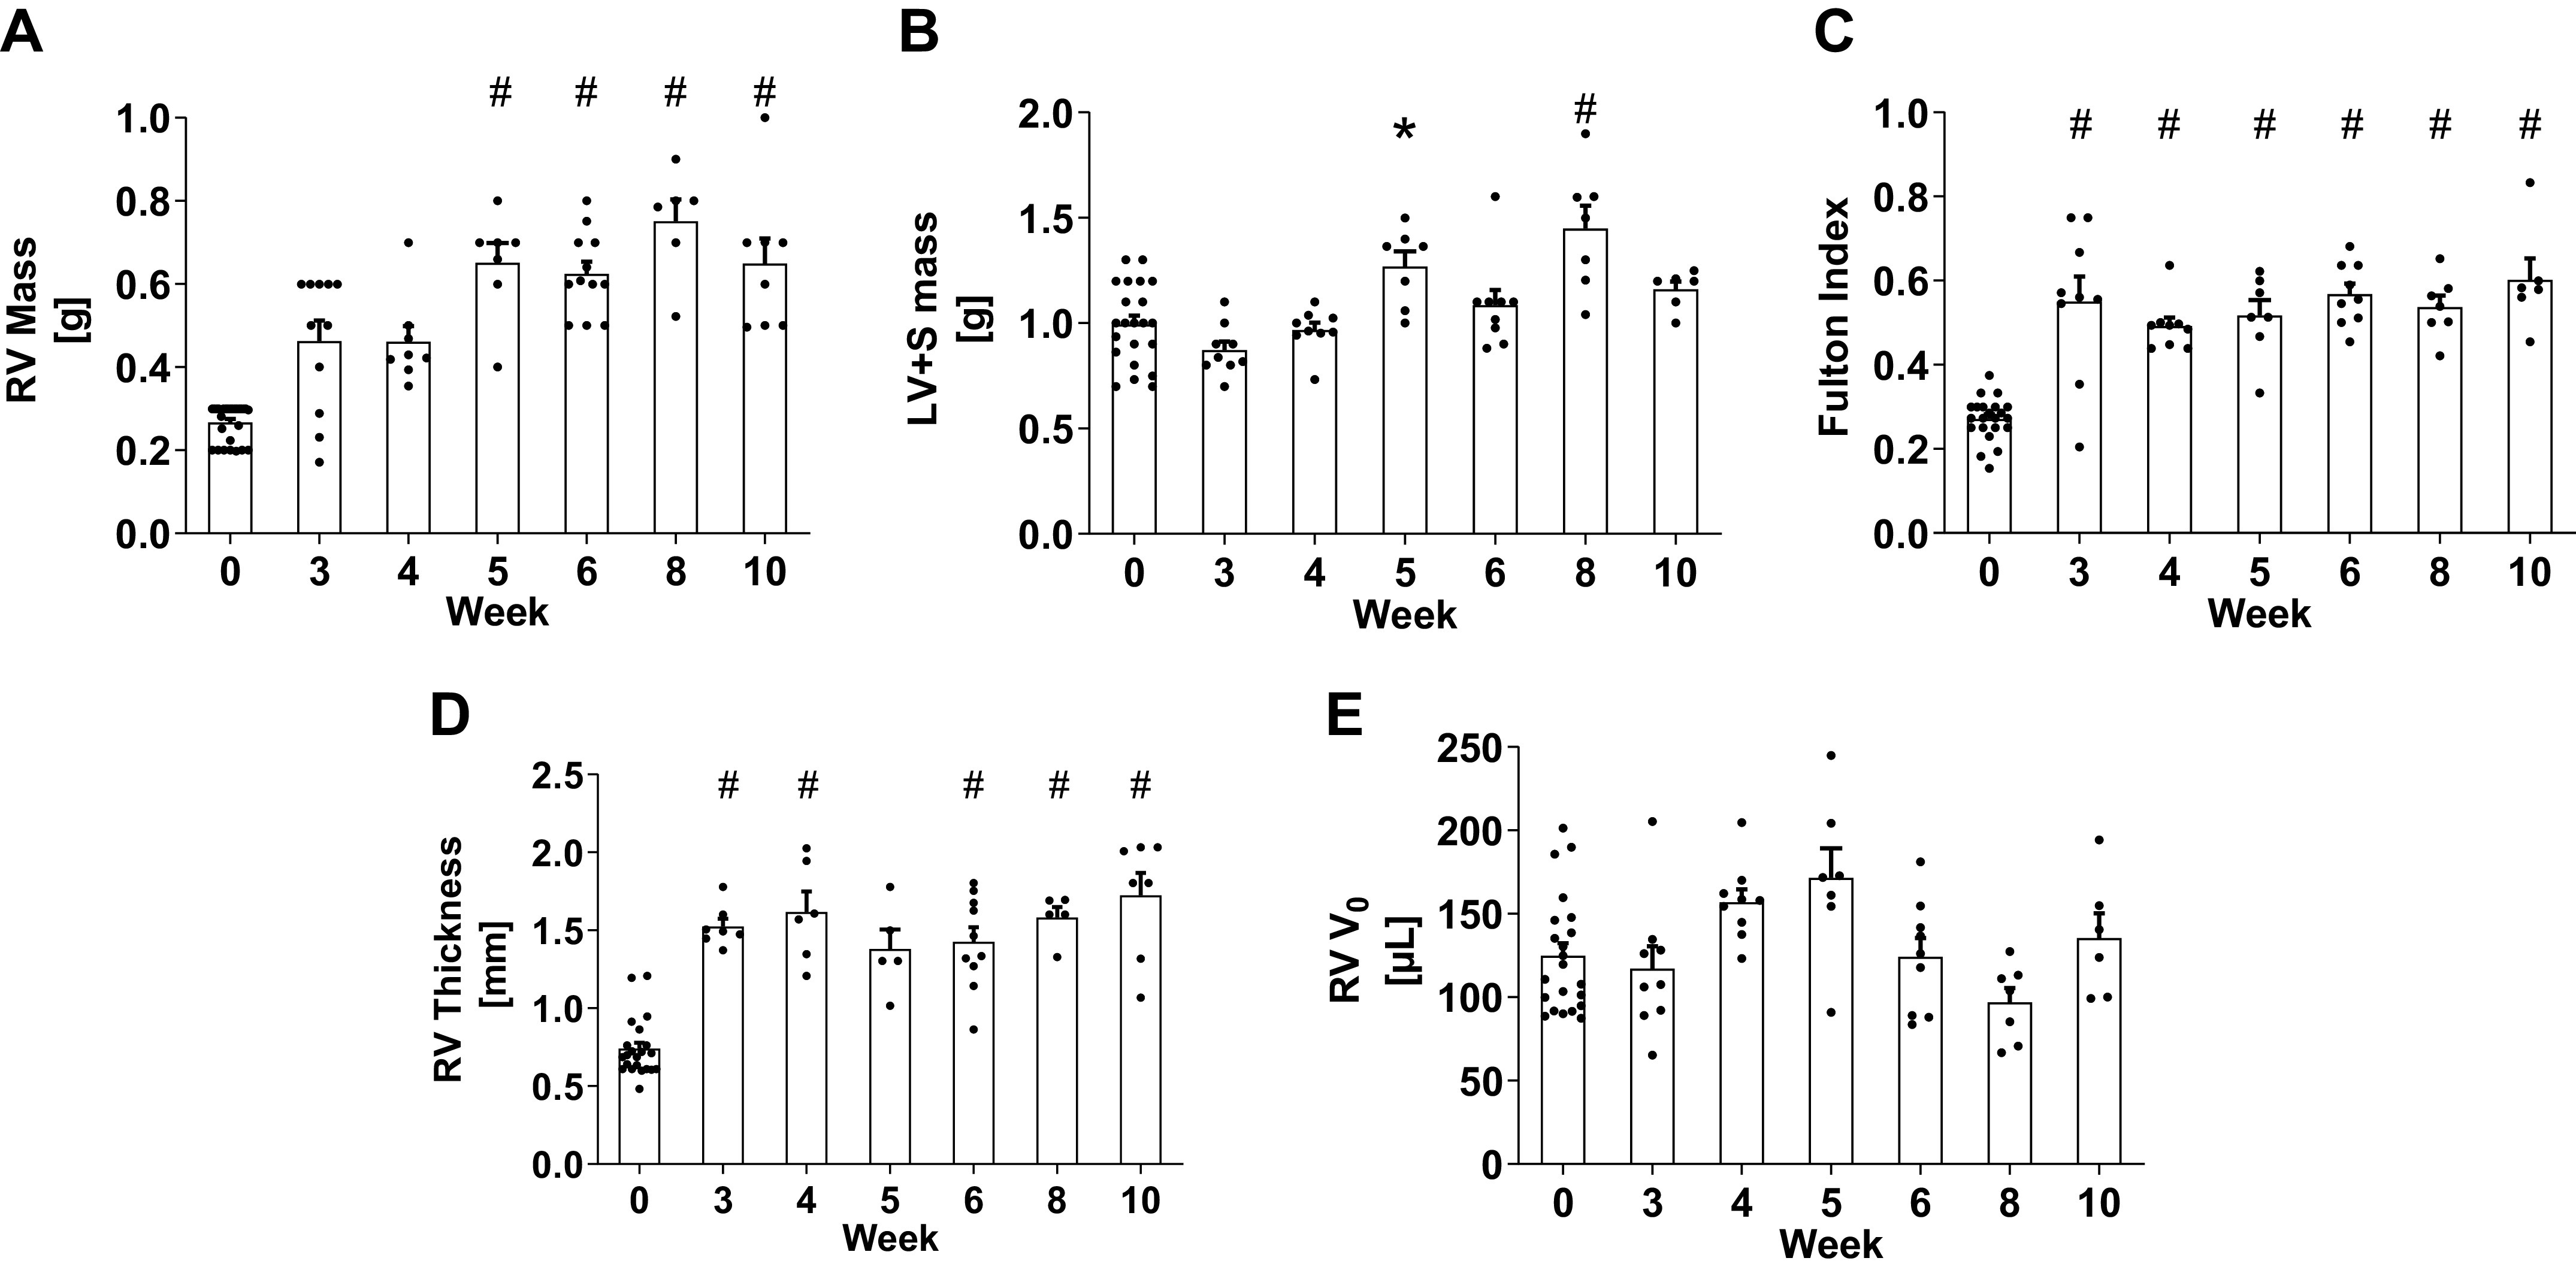
Figure 2.

Masses of right ventricle (A), left ventricle plus septum (B), and their mass ratio (C), and right ventricular wall thickness (D) and estimated V0 (E). Data are shown as means ± SE, *P < 0.05 and #P < 0.01 compared with the control group. LV, left ventricle; S, septum; RV, right ventricle; V0, unloaded volume.
