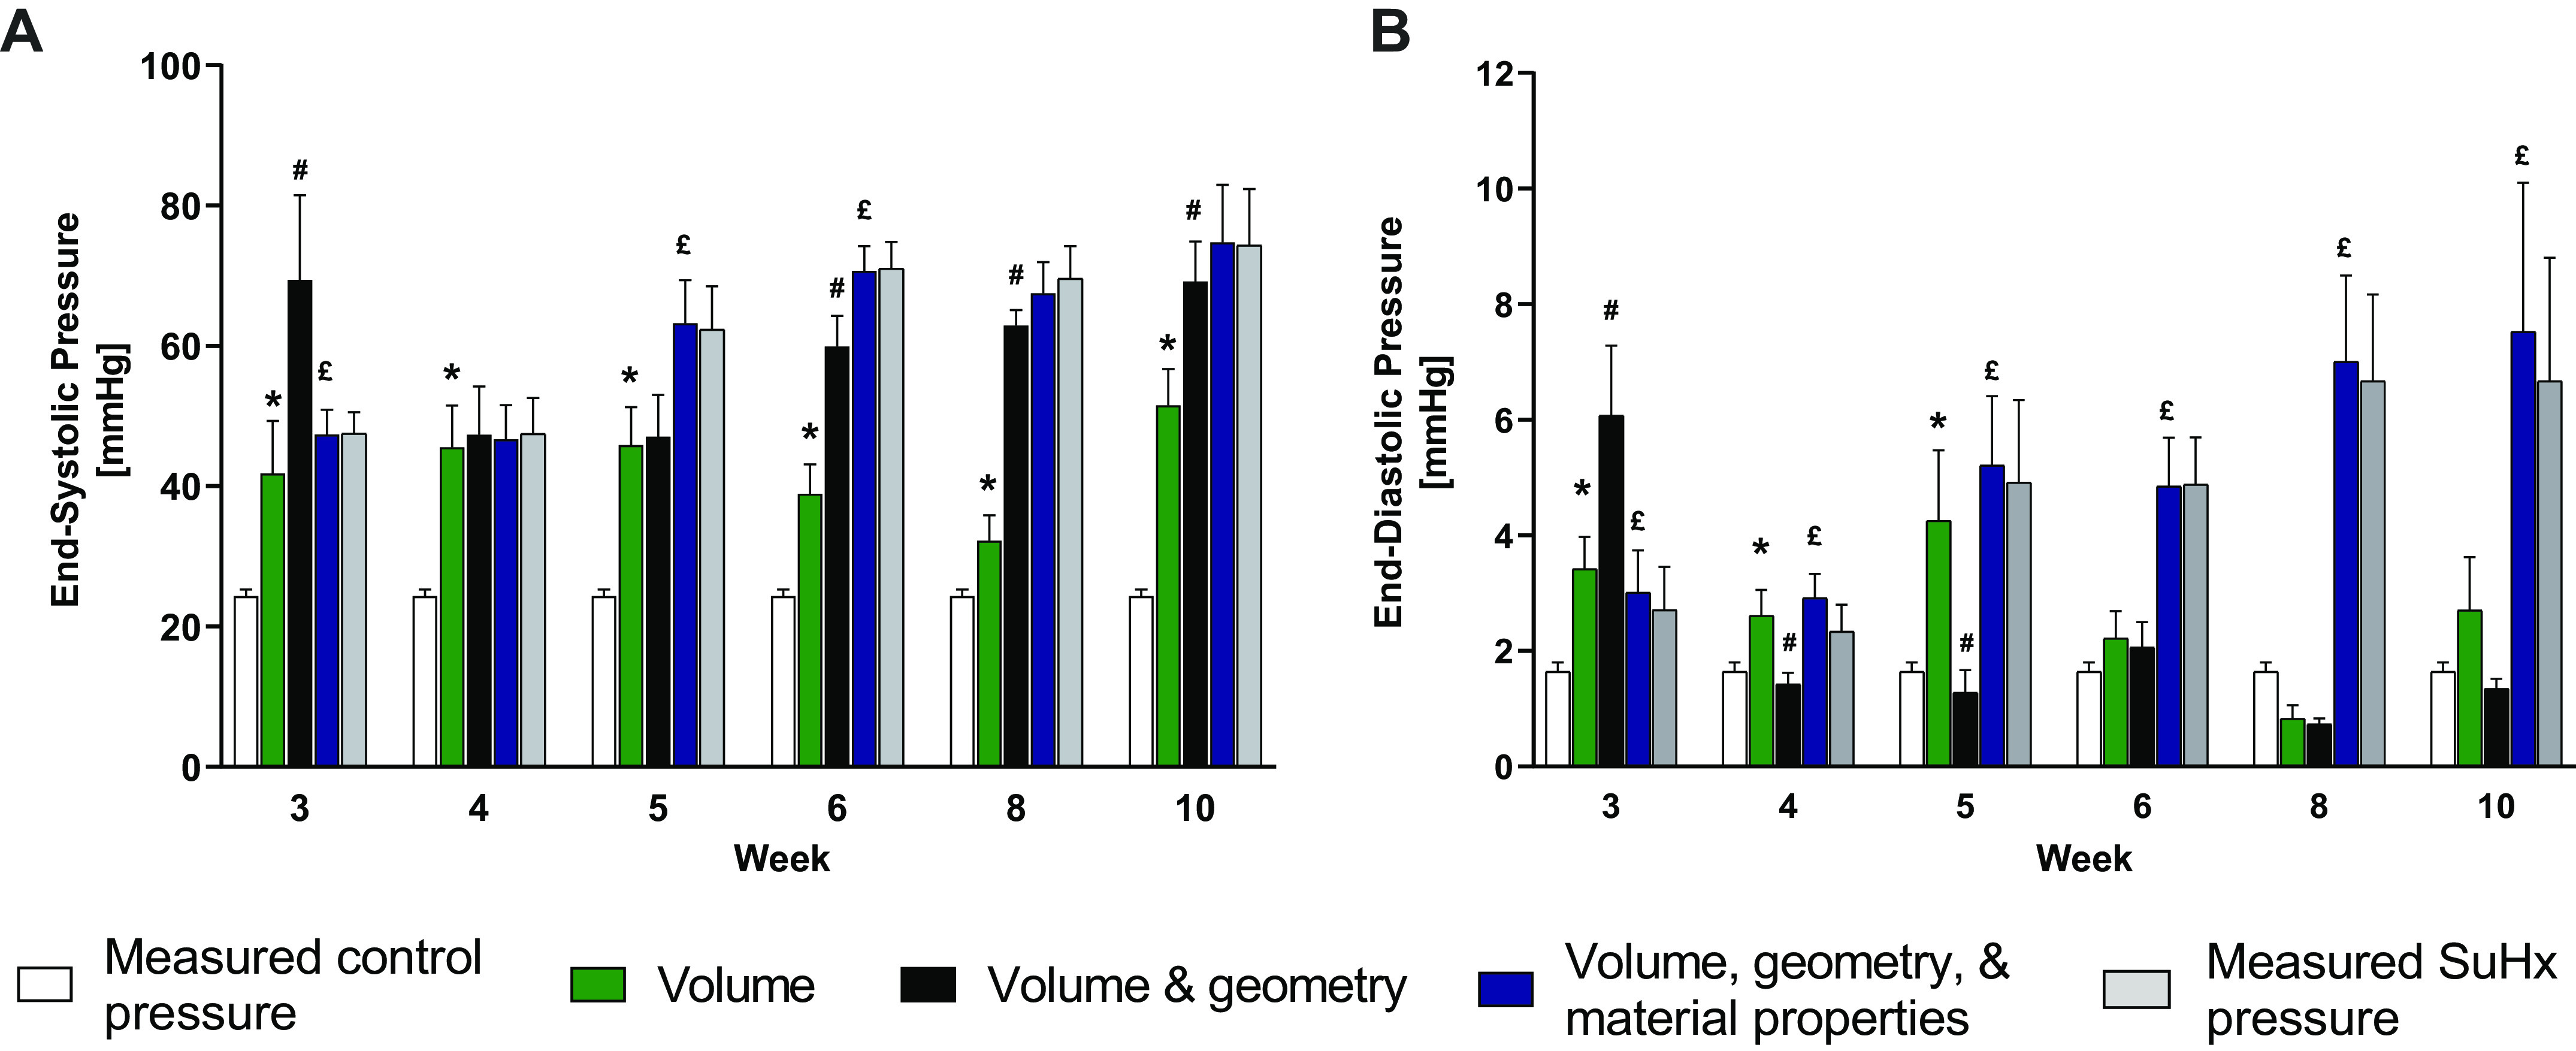
Figure 4.

Measurements of control (white bars) and SuHx (gray bars) RV pressure for end systole (A) and end diastole (B) compared with model predictions of pressure using SuHx volume with control geometry and material properties (green); SuHx volume and geometries with control material properties (black); and SuHx volume, geometries, and material properties (blue). Green bars with * indicate a significant contribution of RV volume to increased ES or ED pressure compared with control (white bars). Black bars with # indicate a significant contribution of RV hypertrophy to increased ES (A) or ED (B) pressure compared with the contributions of volume alone (green bars). Blue bars with £ indicate a significant contribution of altered myofilament activation (A) or myocardial resting stiffness (B) to increased ES or ED pressure compared with volume and geometry (black bars). Data are shown as means ± SE, P < 0.05. ED, end-diastolic; ES, end-systolic; RV, right ventricle; SuHx, sugen-hypoxia.
