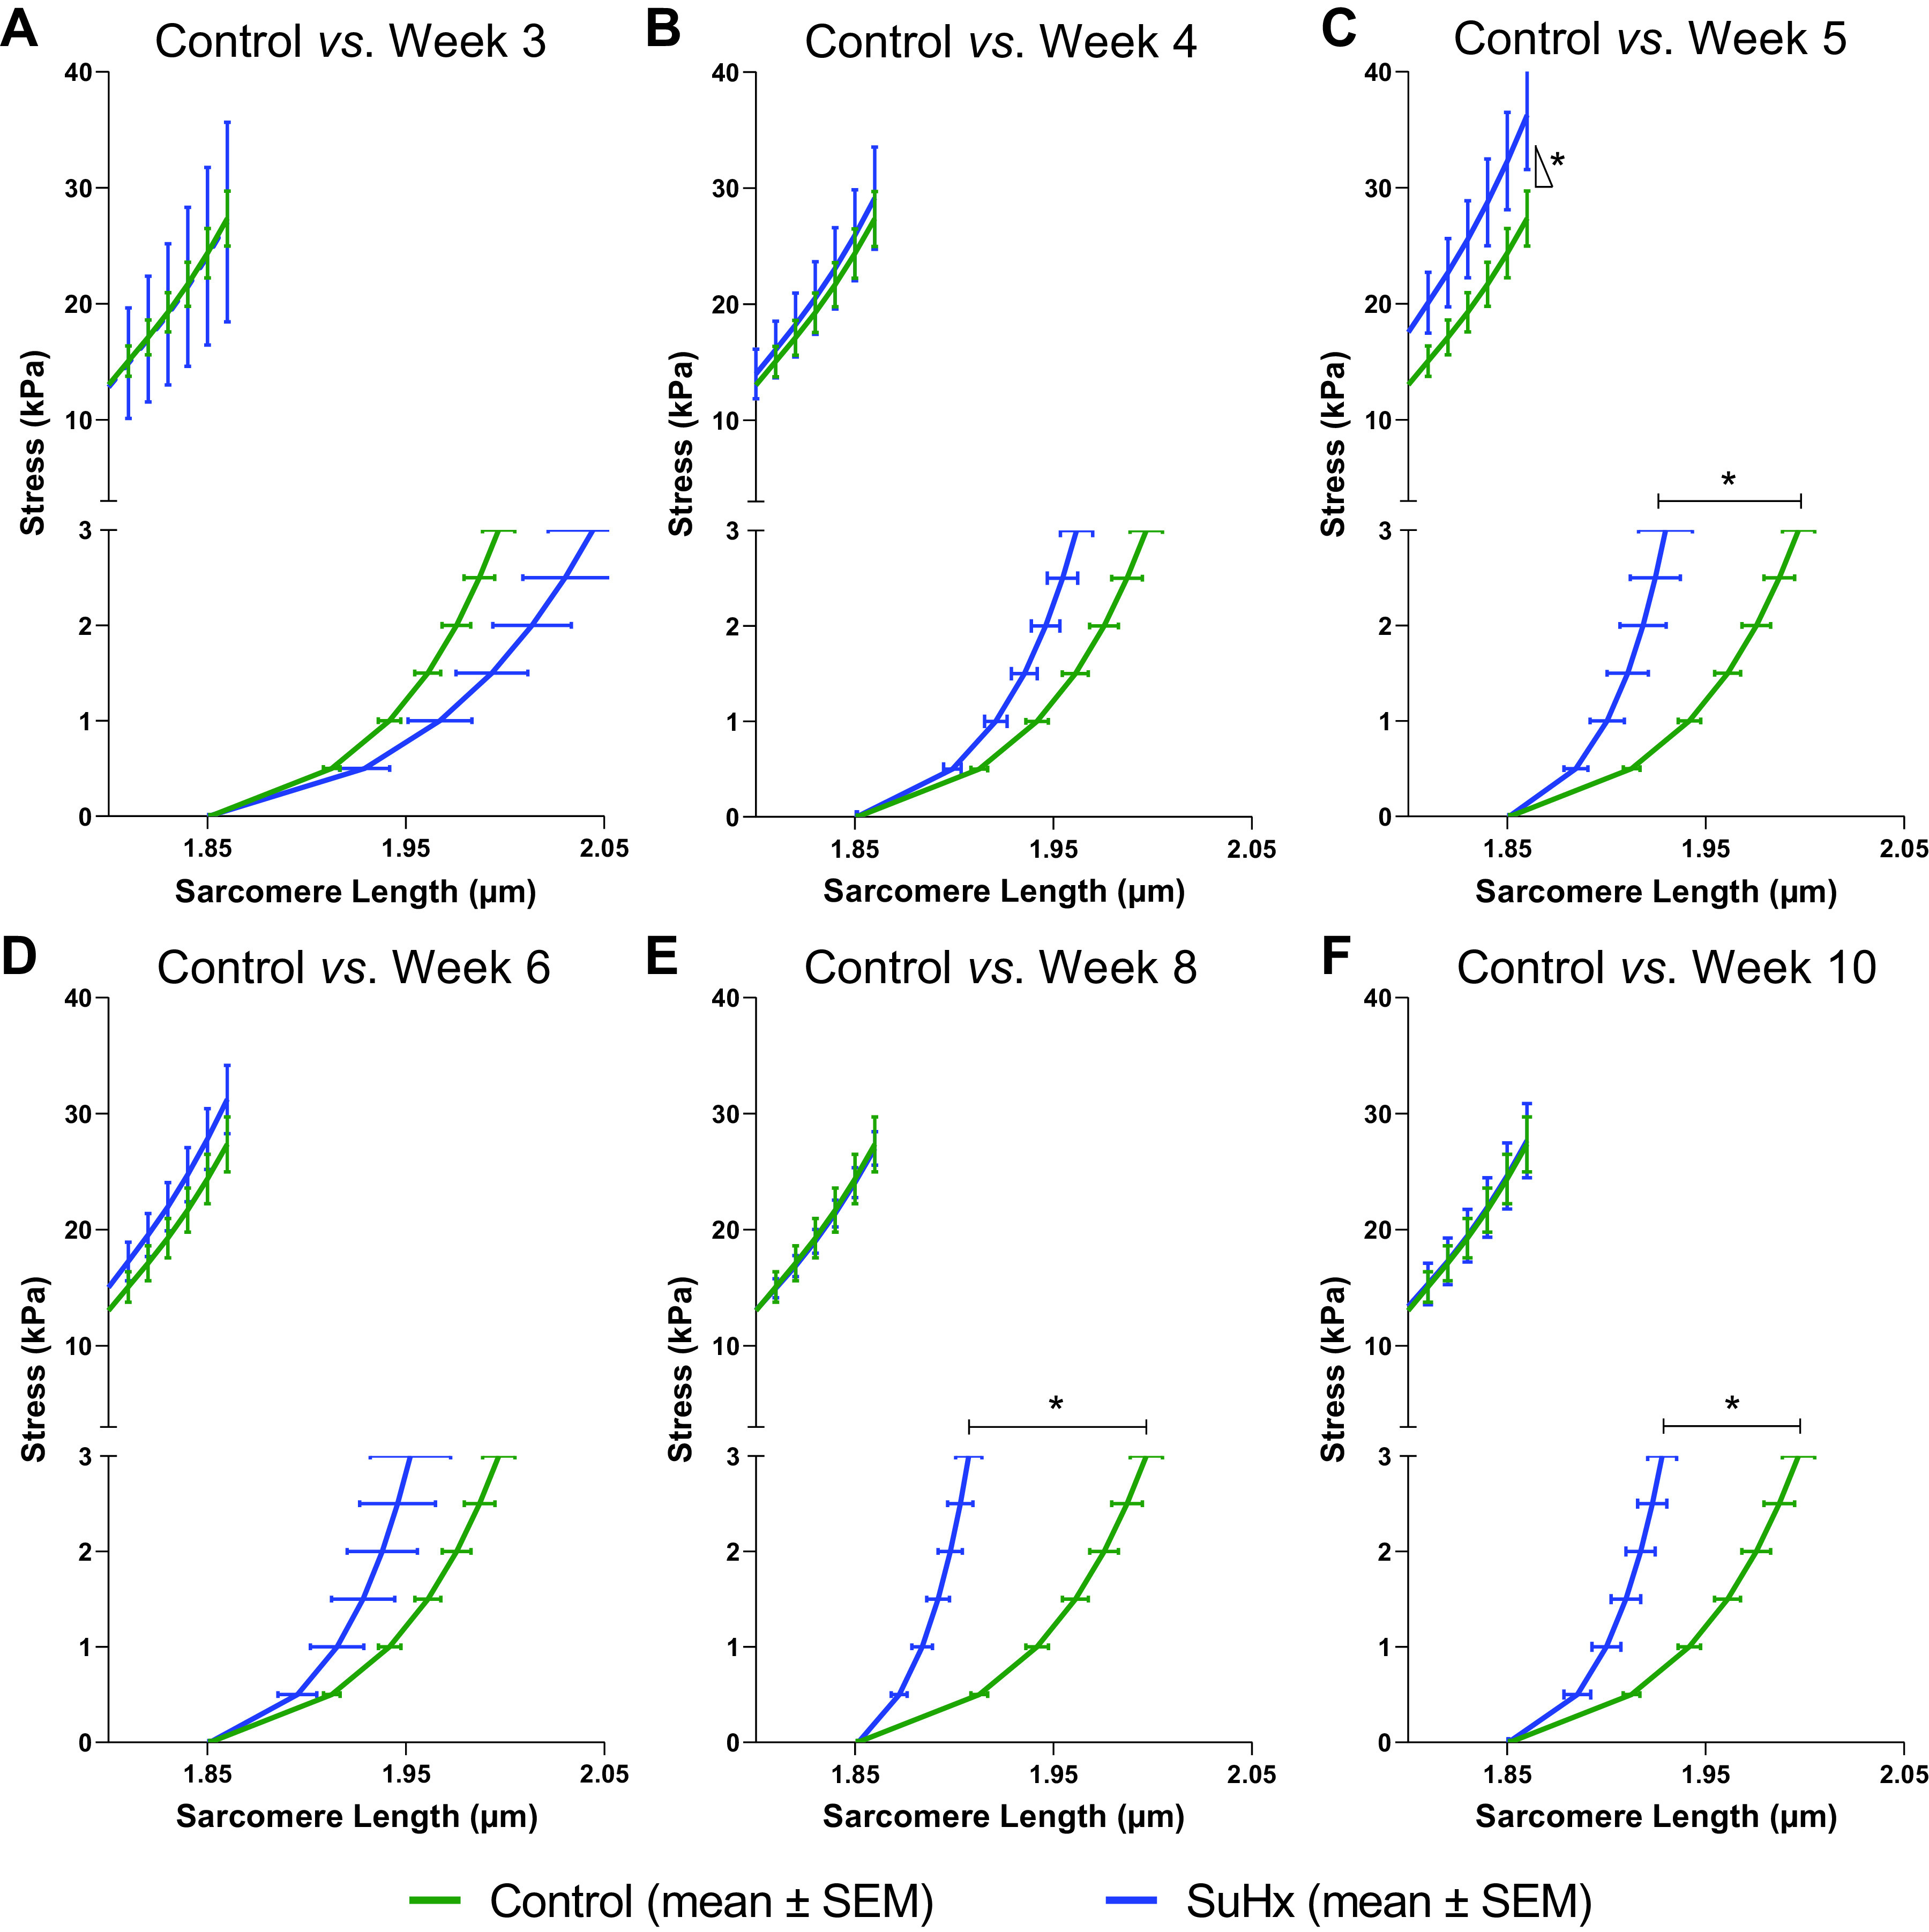
Figure 5.

Model-predicted mean active end-systolic (top) and passive end-diastolic (bottom) fiber stress-sarcomere length relations for control (green) and SuHx (blue) rats at weeks 3 (A), 4 (B), 5 (C), 6 (D), 8 (E), and 10 (F). The slope of the active stress-sarcomere length relation was only significantly higher than control in week 5 (P < 0.05). Predicted mean passive stress-sarcomere length relations were significantly stiffer in SuHx than in control rats at weeks 5, 8, and 10 (*P < 0.05). SuHx, sugen-hypoxia.
