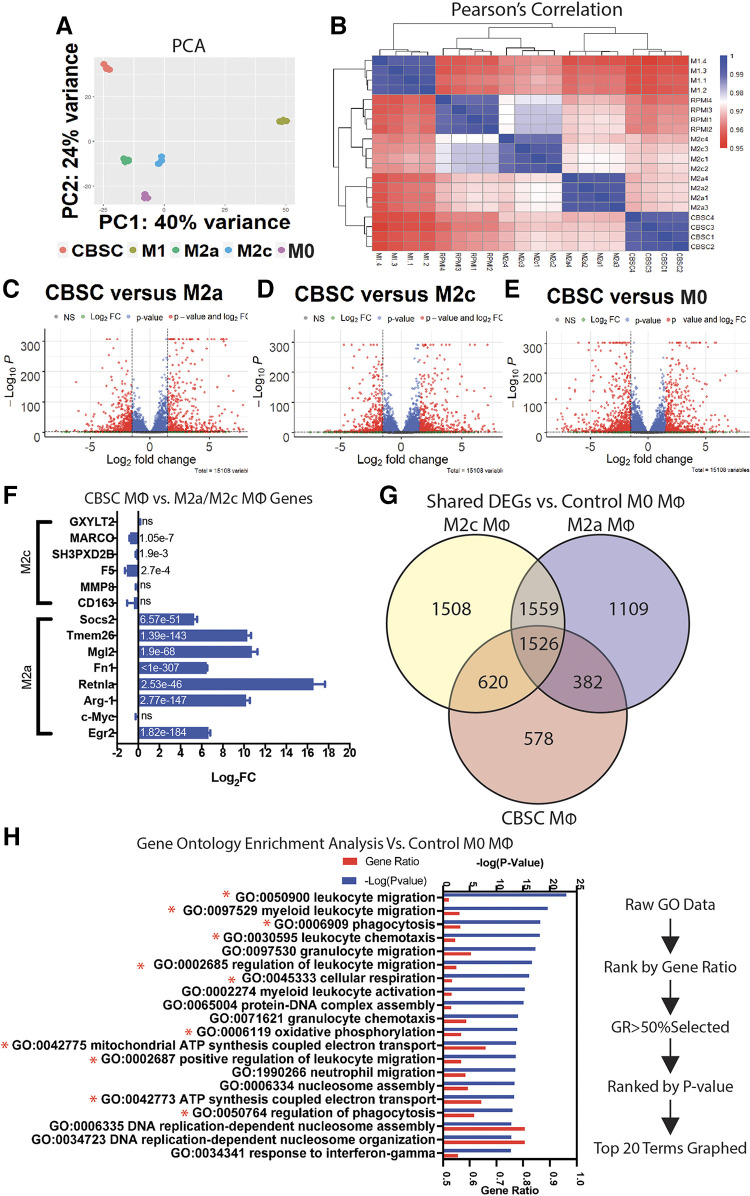
Figure 5.
A: CBSC-treated macrophages display a unique transcriptome. Principal component analysis of CBSC, M1 (50 ng/mL LPS), M2a (40 ng/mL IL-4), M2c (40 ng/mL IL-10), and M0 (no treatment) macrophages; principal components 1 and 2 represent 64% of total variance. B: heatmap of Pearson’s correlation coefficients between all groups. C–E: volcano plots of fold change vs. −log(P value) representing differentially expressed genes (DEGs) in CBSCs vs. M2a, M2c, and M0 macrophages. F: log2(fold change) of specific M2a- and M2c-related genes with adjusted P value in bar; values derived from CBSC vs. M2c for M2c genes, CBSC vs. M2a for M2a genes. G: Venn diagram showing DEGs and common genes between M2c, M2a, and CBSCs vs. M0 control macrophages. H: gene ontology enrichment analysis and ranking system based on DEGs of CBSC vs. M0 control. n = 4 for all groups. CBSCs, cortical bone stem cells.

