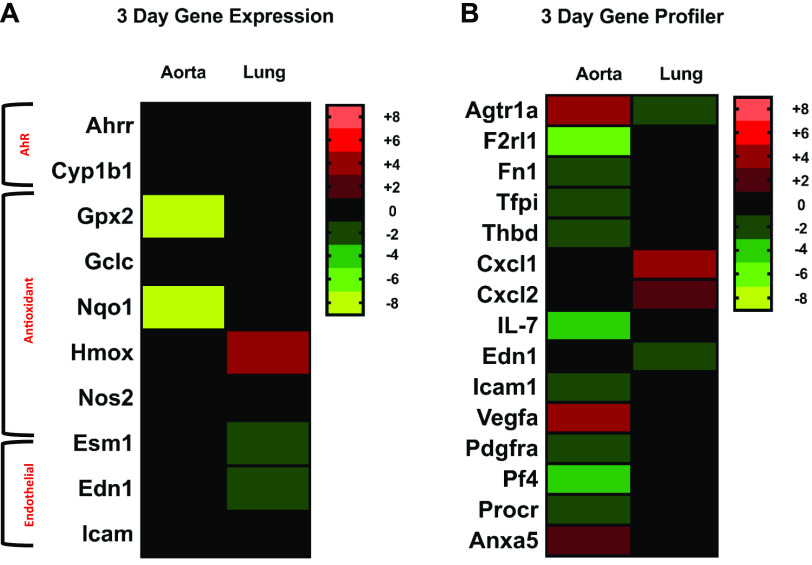
Figure 8.
Heat maps representing lung and aorta gene expression data from the 3-day study. Heat maps were generated for the 3-day gene expression data for both the lung and aorta tissues. A: as with the 4-h and 10 day heat maps, the genes were grouped according to function and shaded to reflect change. Red and green indicate increases and decreases in fold change, respectively, and the brighter the color, the greater the change. Black represents no significant change in gene expression and the scale on the right of the heat maps describes the range of values for each color (n = 5–8/group, P ≤ 0.05). B: RT2 Profiler PCR Array was also used to determine the expression of 84 endothelial cell biology genes in the aortas and lungs of the 3 day mice and a heat map for the analysis was generated for any significant fold changes (aortas: n = 4/group; lungs: n = 8/group, P ≤ 0.05).

