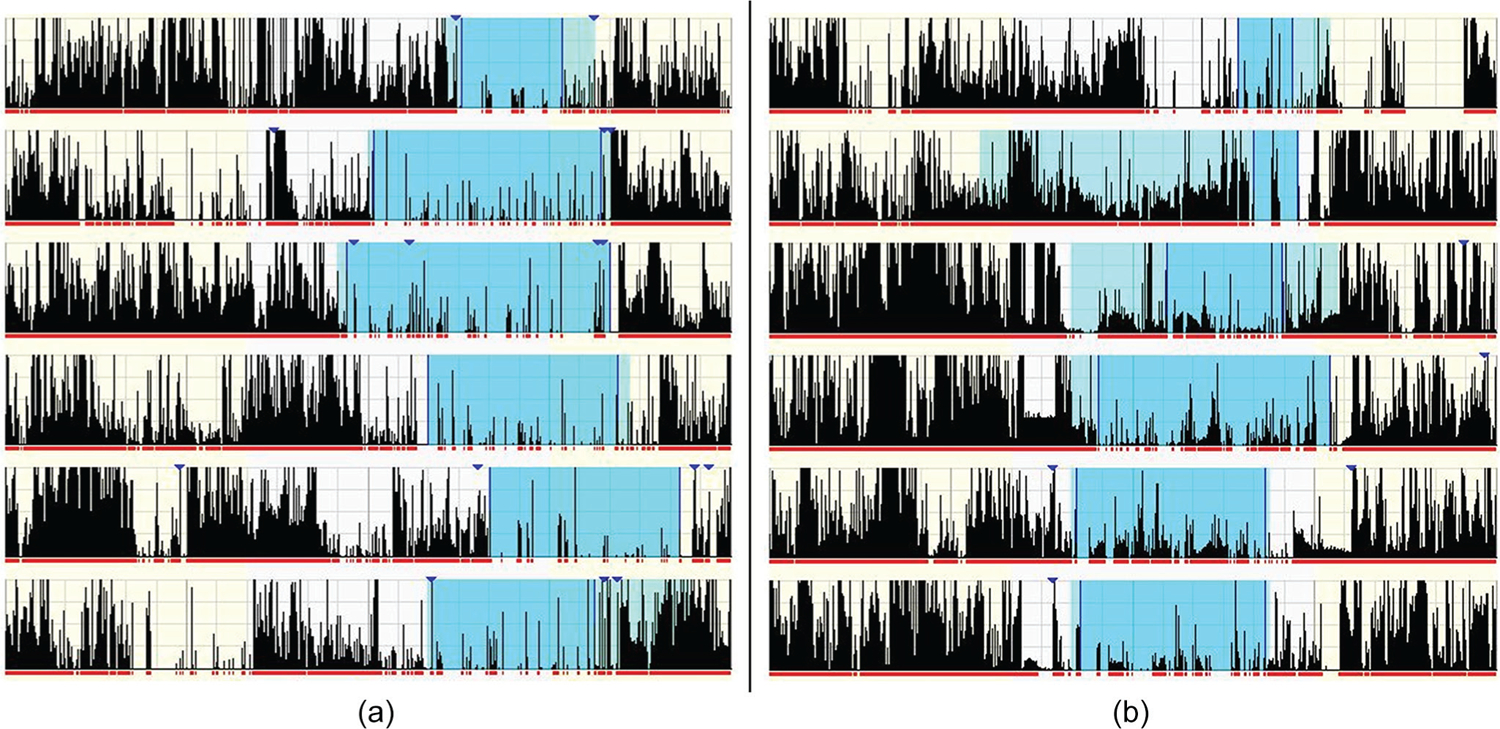
Figure 1.

Representative actograms of diurnal rhythms. Panel A represents an individual with insomnia (IS = .38, IV = 0.79, RA = .84, SRI = 75.82). Panel B represents an individual with PTSD (IS = .35, IV = 0.91, RA = .62, SRI = 77.65). Each row indicates 24-hours from mid-day to mid-day. Diary-reported rest intervals are the shaded sections, and activity counts per 60-second epoch are indicated by the height of each vertical line.
