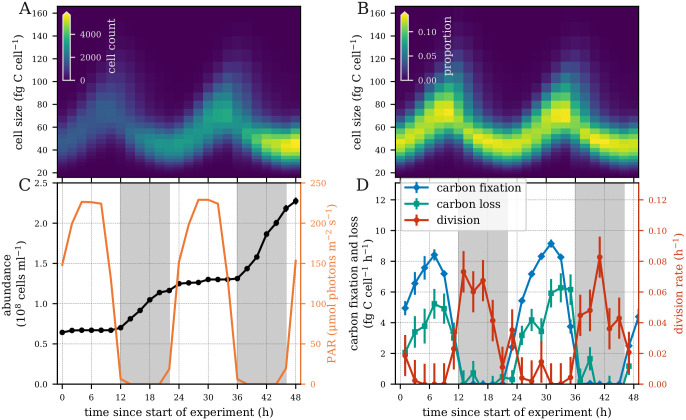
Fig 2. Laboratory Prochlorococcus time series measurements.
(A) Heatmap of the number of cells and (B) relative cell abundances in each size class measured every two hours over a 48-hour period. (C) Cell abundance and photosynthetically active radiation (PAR). (D) Hourly carbon fixation, carbon loss, and division rates. Error bars indicate one standard deviation based on two technical and two biological replicates.

