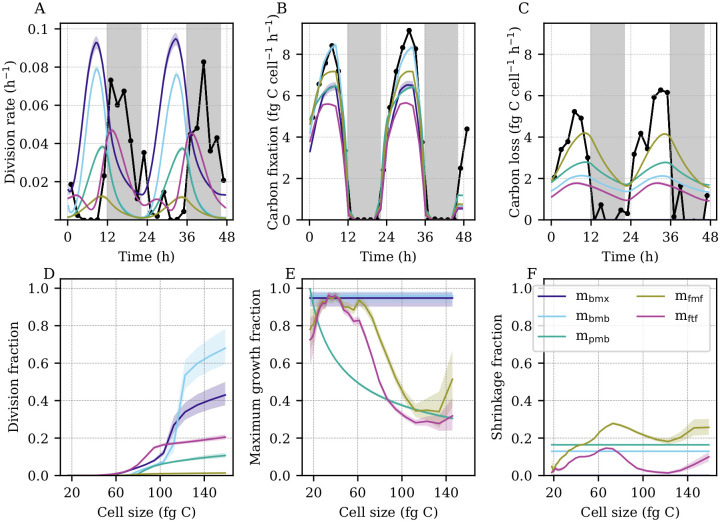
Fig 5. Model estimated hourly rate parameters.
(A) Observed (black) and estimated (colored bands) hourly division rates. (B) Observed (black) and estimated (colored bands) hourly carbon fixation. (C) Observed (black) and estimated (colored bands) hourly carbon loss. (A-C) Black points indicate ground truth calculated from data. (D) Estimated cell division fraction as a function of cell size. (E) Estimated light-saturated cell growth (carbon fixation) fraction as a function of cell size. (F) Estimated cell shrinkage (carbon loss) fraction as a function of cell size. (A-F) Colored bands indicate model estimates. Shading indicates the first to third quartiles of the posterior distributions. (D-F) Fractions correspond to MPM transitions over a 20-minute time period.

