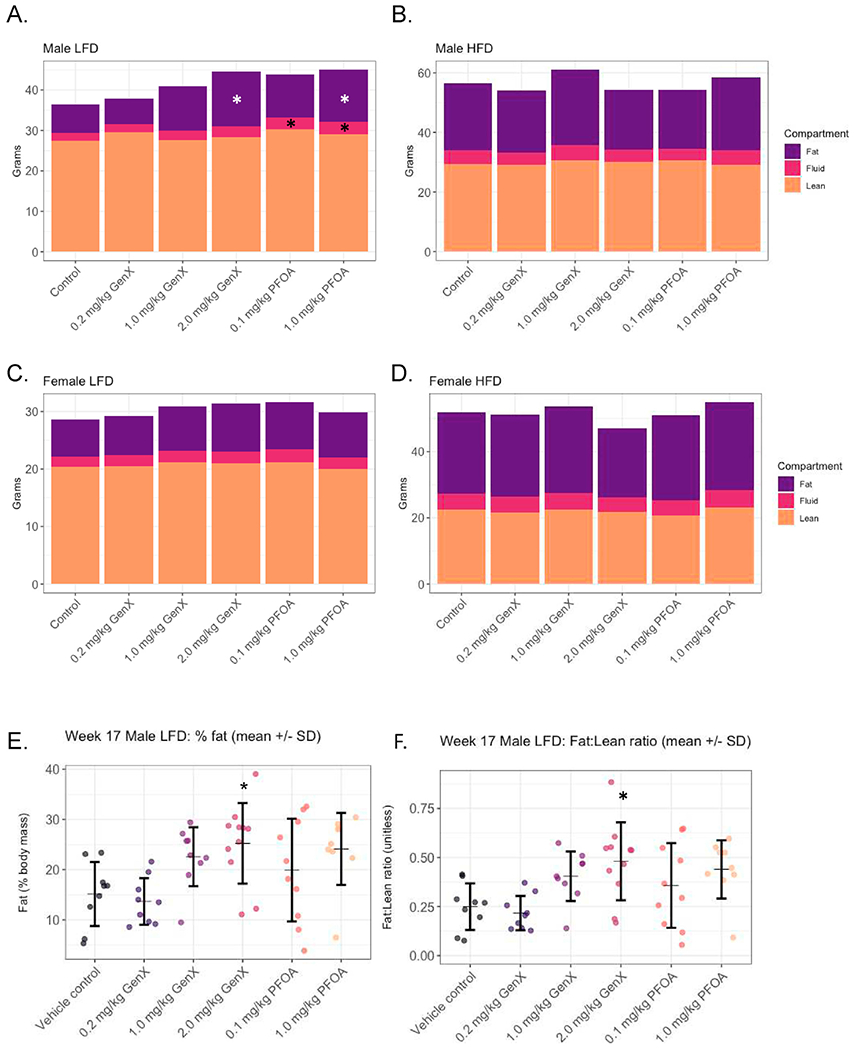
Fig. 4. Body composition parameters at Week 17.

(A) Low fat diet (LFD) male offspring, (B) high fat diet (HFD) male offspring, (C) LFD female offspring, and (D) HFD female offspring grams of fat mass, fluid mass, and lean mass. Bars represent mean grams of mass per group calculated using LF90 Minispec Body Mass Analyzer. Additional data for males on LFD are shown in E) Relative fat mass expressed as percent total body mass, and F) Ratio of fat mass to lean mass. Circles represent individual data points within a treatment group (N = 7–11 mice/group) and horizontal dashes represent the group mean flanked by the standard deviation above and below in black error bars. *P < 0.05.
