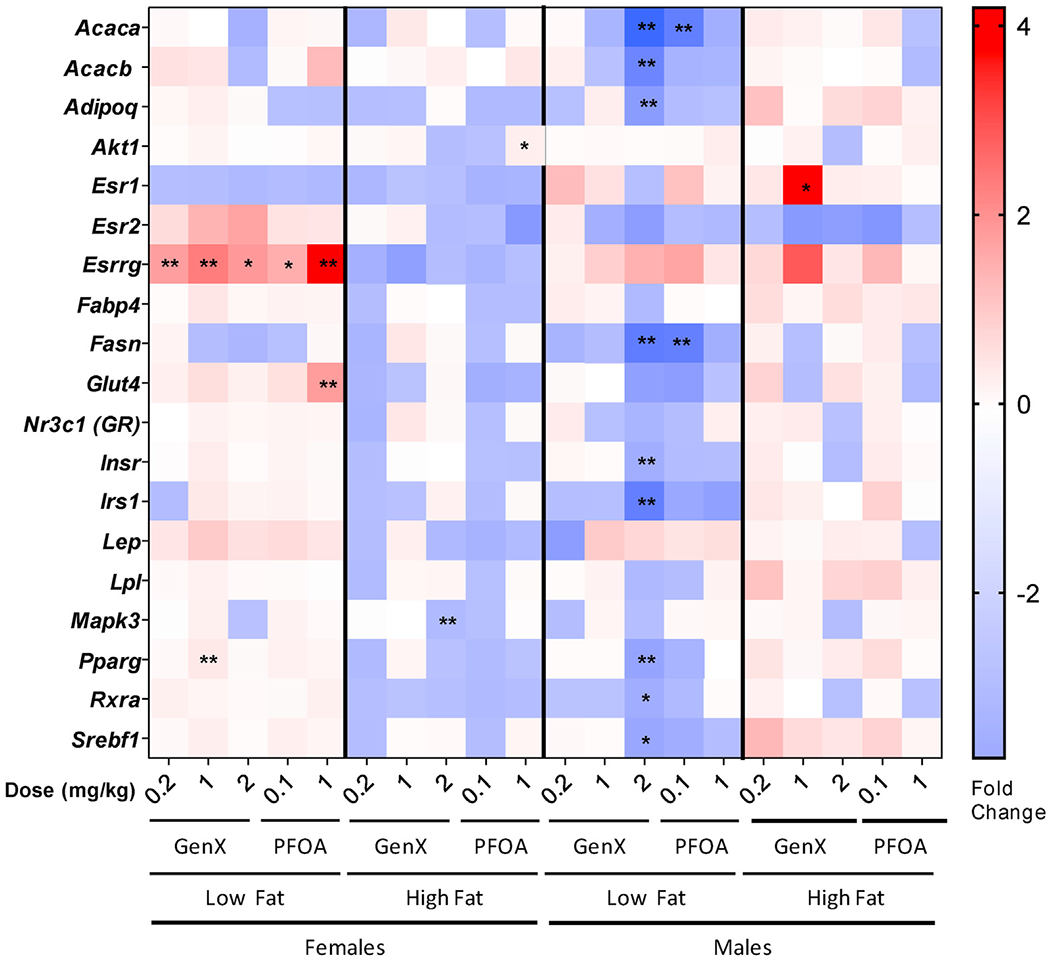
Fig. 6. Heat map of white adipose tissue (WAT) mRNAs altered by PFOA or GenX at 18 weeks of age.

Messenger RNA expression was quantified by RT-qPCR using WAT from 18-week old mice prenatally exposed to either PFOA or GenX. Relative gene expression data are represented as mean fold change over VC in heatmap format, with red indicating an increase expression up to a 4-fold change and blue indicating a decrease in expression down to a 4-fold change, N = 4. Low fat and high fat denote the different diets. ANOVA with multiple comparisons Dunnett’s post hoc was performed on mean dCt values with statistical significance of *P < 0.1 and **P < 0.05.
