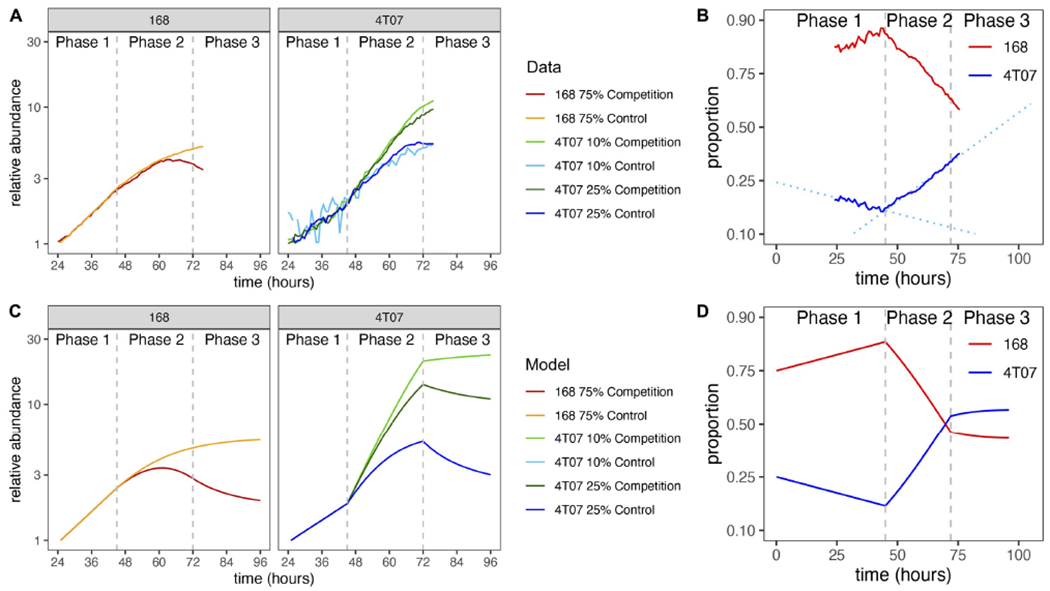
FIGURE 3 |.

Normalized growth curves of homotypic and heterotypic mixes of subclones. (A) The GFP fluorescence of the labeled subclone was measured by time-lapse microscopy. Cultures were seeded with 105 cells per well. Log-transformed data were normalized by fitting regression lines and dividing by the inferred value at 24 h. Vertical dashed lines mark the start of phase 2 (45 h) and phase 3 (72 h). (B) Frequency dynamics. Curves obtained by combining the results of two competition experiments: one with labeled 4T07 and the other with labeled 168. The initial 4T07 proportion was 25% in both cases. The vertical axis is logit-transformed so that the slope of each curve is equal to the difference in net growth rates at the corresponding time (see section “Materials and Methods”). Dotted regression lines are shown to draw attention to the change of slope. (C) Normalized growth curves according to mathematical model with parameter values inferred from data. The model is described in section “Materials and Methods” and parameter values are given in Table 1. (D) Frequency dynamics according to mathematical model with parameter values inferred from data.
