Figure 1. Fetal characteristics at gestational day 18.5.
(A) Body weight of male and female fetuses from healthy control (CTL) and obese (OB) mouse dams at gestational day 18.5. Male CTL n = 6, male OB n = 6, female CTL n = 7, female OB n = 6. (B–C) Heart weight and heart weight/litter average body weight ratio of male and female fetuses from CTL and OB dams at gestational day 18.5. Male CTL n = 10, male OB n = 10, female CTL n = 12, female OB n = 12. (D) Histological sections stained with eosin of male and female fetuses from CTL and OB dams at gestational day 18.5 used in cardiac stereology (see also Figure 1—figure supplement 1). Scale bar indicates 500 µm. (E–H) Left and right ventricular wall volume and ventricular wall volume/body weight ratio of male and female fetuses from healthy control (CTL) and obese (OB) mouse dams at gestational day 18.5. Male CTL n = 4, male OB n = 6, female CTL n = 4, female OB n = 5. (I) Boxplot showing median and quartiles of cardiomyocyte area distribution in male and female fetuses from CTL and OB dams at gestational day 18.5. Under the boxplot a beeswarm plot shows individual area of each cardiomyocyte analysed. Male CTL n = 6, male OB n = 7, female CTL n = 6, female OB n = 6 (see Figure 1—figure supplement 2 for a representative image of stained cardiomyocytes). (J) Nuclear PCNA-positive cells percentage in hearts of male and female fetuses from CTL and OB dams at gestational day 18.5. Male CTL n = 6, male OB n = 5, female CTL n = 3, female OB n = 5. In panels A-H and J, p-values were calculated by Student t-test. In panel I, p-values were calculated using linear mixed-effects model followed by Tukey’s post-hoc test.
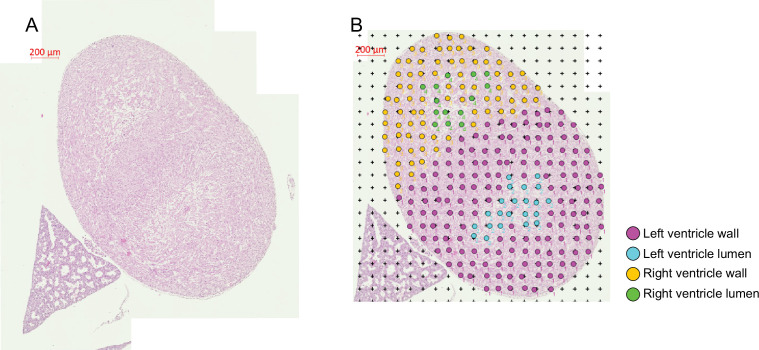
Figure 1—figure supplement 1. Stereological analysis of the gestational day 18.5 fetal heart.
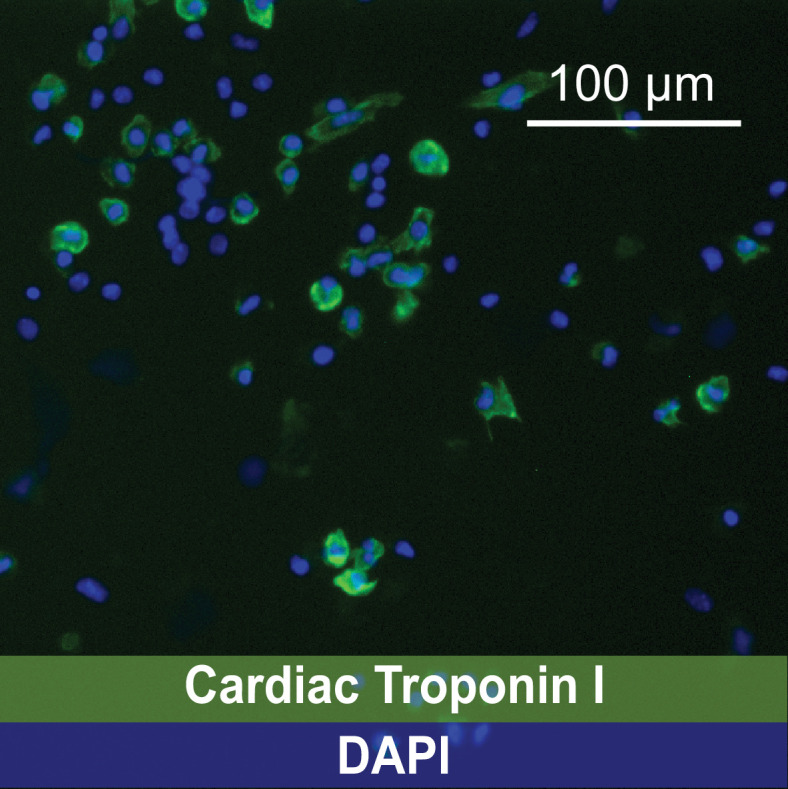
Figure 1—figure supplement 2. Representative image of immunofluorescence identifying cardiomyocytes using a mAb anti-Cardiac Troponin I IgG followed by incubation with an Alexa Fluor 488-conjugated secondary IgG.


