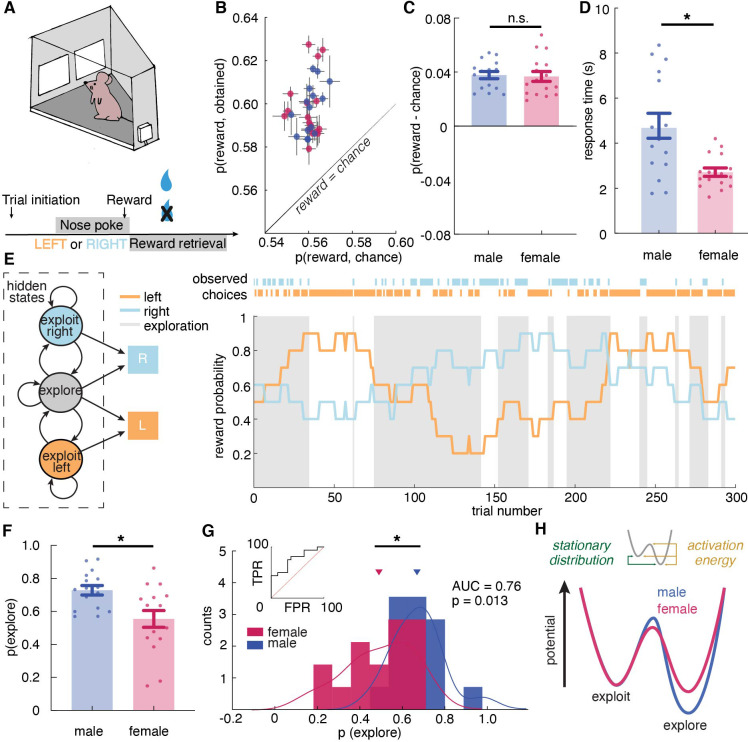
Figure 1. Male and female mice showed different exploratory strategies in a restless bandit task - males explored more than females, and they explored for longer periods of time once started.
(A) Schematic of the mouse touchscreen chamber with the restless two-armed bandit task and trial structure. (B) Average probability of obtaining reward compared to the chance probability of reward across individuals (dots). (C) Average probability of obtaining reward compared to the chance probability of reward across sexes. (D) Average response time across sexes. Females responded significantly faster than did males. (E) (left) A hidden Markov model that labeled exploration and exploitation as latent goal states underlying observed choices. This model includes an exploitation state for each arm and an exploration state where the subject chooses one of the arms randomly. (right) Reward probabilities (lines) and choices (dots) for 300 example trials for a given mouse. Shaded areas highlight explore-labeled choices. (F, G) Average (F) and distribution (G) of the percentage of Hidden Markov Model (HMM)-labeled exploratory trials in females and males. (H) Dynamic landscape of the fitted HMMs for males and females. The model fit to males had deeper exploratory states, with higher activation energy between the states. * indicates p < 0.05. Graphs depict mean ± SEM across animals.


