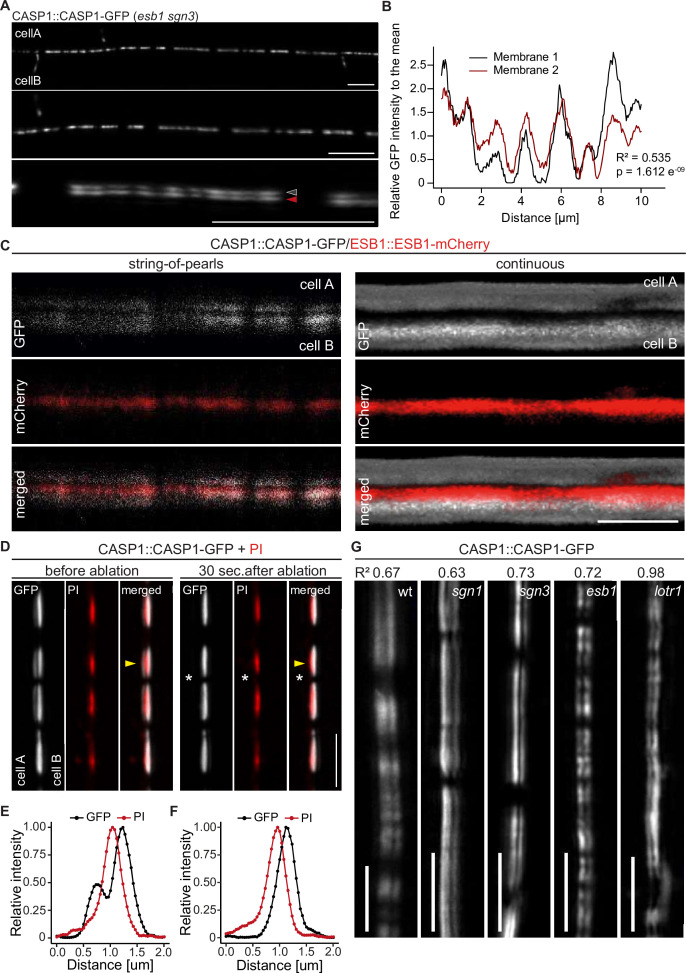
Figure 2. CASP deposition is coordinated between neighboring endodermal cells.
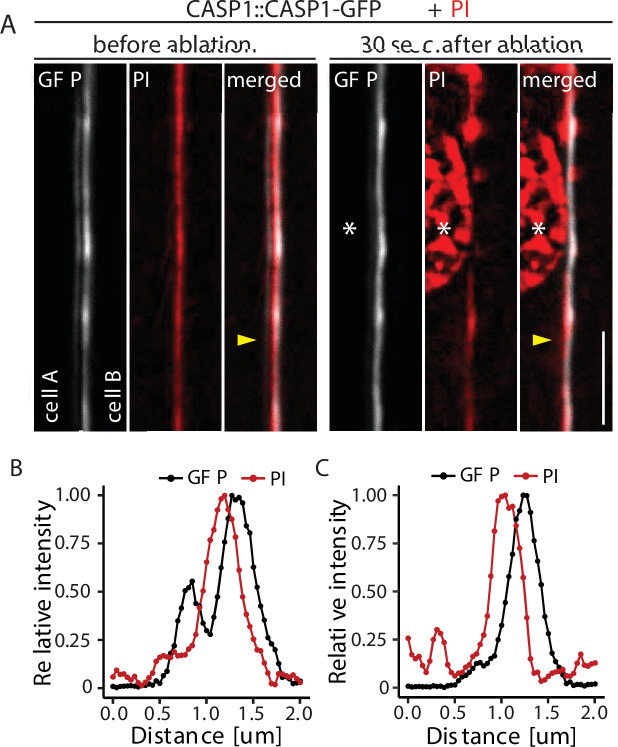
(A) Double membrane phenotype visible with CASP1::CASP1-GFP during string-of-pearls stage of CS development, scale bars depict 10 µm. Red and gray arrows indicate separate membranes measured in (B). (B) Comparison of GFP intensity between adjacent membranes indicated in (A). Pixel intensity was measured along each membrane and relative GFP intensity was adjusted to mean intensity of each membrane. Correlation of original intensities (R-squared) was determined by fitting of a linear model with indicated probability of fit (p-value). (C) Localization of CSD marker CASP1-GFP in comparison to cell wall protein ESB1-mCherry at early and mature CSs, scale bar depicts 5 µm. (D) Double membrane phenotype of CASP1-GFP before and after ablation of one adjacent endodermal cell in early CSs. Cell walls (red) are stained with Propidium iodide (PI), yellow arrows indicate intensity profiles measured in F-I; asterisks indicate ablated cell, scale bars = 5 µM. (E + F) Quantification of CASP1-GFP and PI intensity before and after cell ablation. Intensity was quantified in a 7-pixel wide line indicated in (D) and (E). (G) Double membrane phenotype in CS mutants, scale bars = 5 um. R2 value depicts Spearman rho correlation coefficients of fluorescence of 5-pixel wide lines following each membrane.


