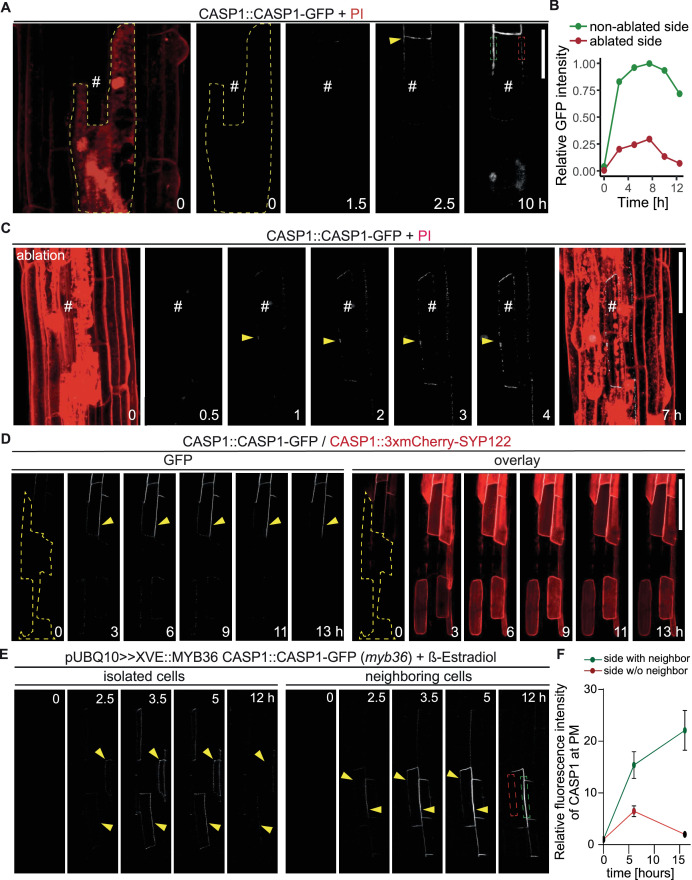
Figure 3. Endodermal neighbors are required for proper CSD establishment.
(A) Endodermal cell ablation leads to instability of the CSD in membranes facing dead cells. Endodermal cells were ablated 3–5 cells prior to onset of CASP1-GFP (white) expression and followed over indicated time spans. First image depicts overview after ablation with cells outlined with PI; # depicts remaining live endodermal cell, dashed yellow line depicts cell outlines of ablated cells, arrow indicates onset of CASP expression, dashed green and red rectangles indicate quantification areas shown in (B), scale bar = 20 µm. (B) Quantification of GFP fluorescence over time in membranes facing live (green) and dead (red) adjacent endodermal cells. Intensity depicted in relation to maximum total GFP intensity. (C) Ablation of all adjacent endodermal cells prevents fusion of CSDs. Endodermal neighbors were ablated at timepoint 0 and CASP1-GFP expression (white) followed over time in remaining cell (#), PI (red) highlighted cell outlines and confirmed destruction of cells; yellow arrow indicates initial CASP microdomains, scale bar = 50 um. (D) CASP instability in membranes facing ablated cells is independent from CASP expression. Cells ablated 3–5 cells prior to onset of CASP expression, cell outline depicted with dashed yellow line, arrow indicates stable CASP formation, scale bar = 100 um. (E) CASP fusion occurs only if both neighboring cells reach expression threshold. Endodermal differentiation was induced via 0.5 µM β-estradiol and CASP1-GFP expression followed over the next 12 hr. Yellow arrows indicate CASP deposits in the membrane, dashed green and red rectangles indicate areas for quantification shown in (F). (F) Quantification of GFP fluorescence over time in membranes reaching local stability threshold (green) and those below the threshold (red).


