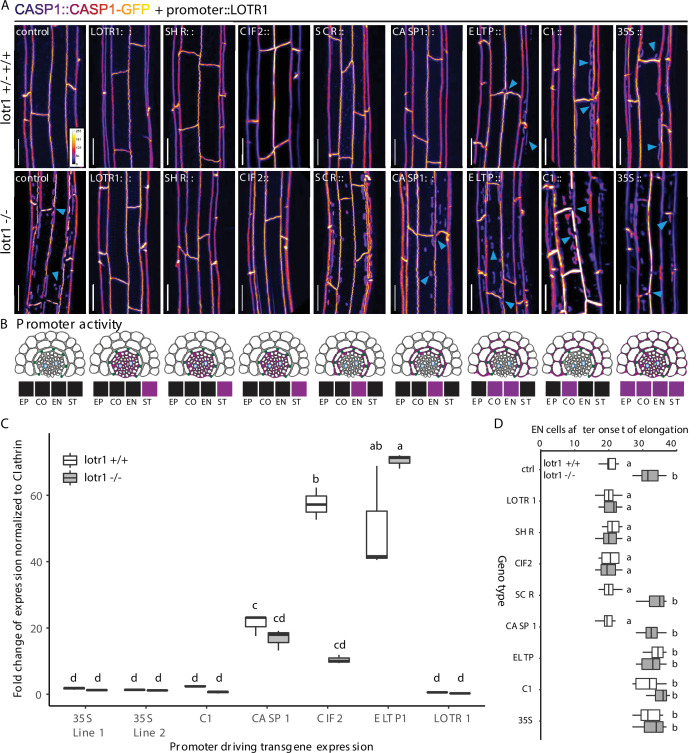
Figure 5. Stele-specific LOTR1 restricts CSD establishment.
(A) Mis-expression of LOTR1 in cortical cells causes dominant loss-of-function phenotypes. CASP1-GFP phenotypes of seedlings expressing LOTR1-complementation construct (used in Figure 4F) under indicated promoters. Presented pictures represent typical phenotypes observed in more than five independent lines; blue arrows indicate lotr1-like phenotypes; EP = epidermis, CO = cortex, EN = endodermis, ST = stele; scale bars = 20 µm. (B) Schematics of promoter activity to highlight cell-type specific expressions are based on publicly available microarray expression data obtained from the BAR eFP browser (Winter et al., 2007), as well as diverse publications that provide detailed characterisations of these promoters Promoters are as follows: SHR, SHORT ROOT; CIF2, CASPARIAN STRIP INTEGRITY FACTOR 2;SCR, SCARECROW; CASP1, CASPARIAN STRIP DOMAIN PROTEIN 1; ELTP, LTPG15, LIPID TRANSFER PROTEIN G 15; C1, CORTEX 1. Expression indication for LOTR1 was modeled according to the patterns shown in Figure 4E/F. (C) Transgene expression comparison of lines presented in (A) by qRT-PCR. The data presented here are representative of three biological replicates (n = 3) analysed. NOTE: Transgene expression levels do not correlate with occurrence of dominant phenotypes observed in A. Statistical difference was determined using ANOVA to search for significant interactions between expression level, transgene presence and genetic background. Significant interactions were grouped by a post-hoc Tukey-Kramer test and depicted with letters. (D) Apoplastic barrier phenotypes of tissue specific complementation lines in wildtype (white) and lotr1 (grey) background. Cells after onset of elongation counted until penetrance of PI was blocked. n = 10, significance determined via one-way ANOVA and independent groups identified via Tukey-Kramer post-hoc test.


