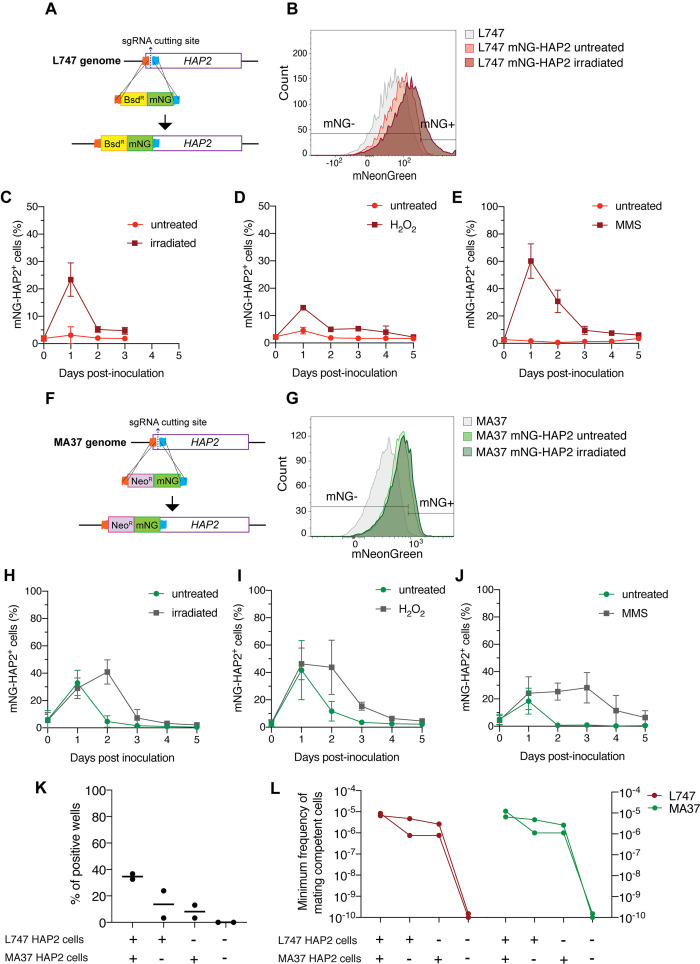
Figure 6. HAP2 protein expression in L. tropica promastigotes is associated with in vitro hybridization capacity.
Schematic representation of the mNeonGreen (mNG)-HAP2 fusion reporter construct generated in the L747 strain (A) and in the MA37 strain (F). Stationary phase promastigotes of either L747 mNG-HAP2 or MA37 mNG-HAP2 parental lines were used to inoculate fresh cultures that were immediately divided into two flasks, with one flask remaining untreated and the other exposed to 6.5 Gy of γ-radiation or supplemented with 250 μM of H2O2 or 0.005% of methyl methanesulfonate (MMS). Flow cytometry histogram plots showing the fluorescence intensity of mNG-HAP2 in L747 (B) and in MA37 (G) 1 day post-inoculation, with or without irradiation. Proportion of mNG-HAP2+ cells over time in L747 mNG-HAP2 cultures with or without exposure to γ-radiation (C), to H2O2 (D) or to MMS (E), n = 3 replicates. Proportion of mNG-HAP2+ cells in MA37 transfectants after exposure to γ-radiation (H), to H2O2 (I), or to MMS (J), n = 4 replicates. (K) Proportion of culture wells exhibiting growth of LMA hybrids after in vitro crosses using the different indicated pairwise combinations of FACS-sorted mNG-HAP2+ and mNG-HAP2- cells 1 day after irradiation; data are presented as mean values (black line) and individual measurements. (L) Minimum frequency of hybridization-competent cells for both L747 and MA37 parental strains in in vitro crosses using different combinations of FACS-sorted mNG-HAP2+ and mNG-HAP2- cells (n = 2 independent experiments). Frequencies collected from each single experiment are linked by a line. Red lines and green lines represent data from L747 and MA37 parental strains, respectively.


