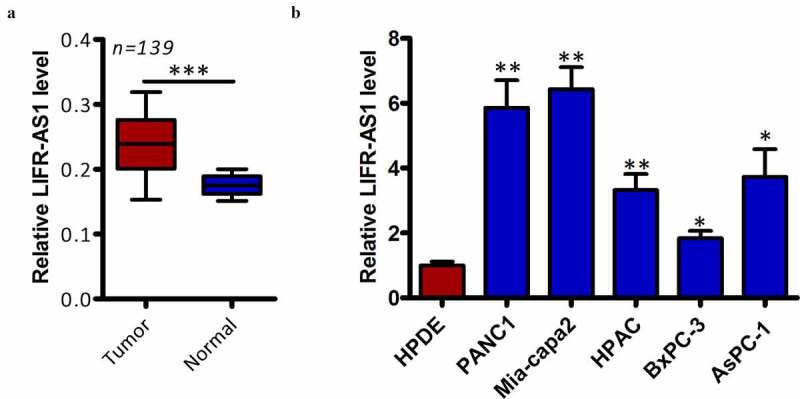
Figure 1.

PC samples exhibit the upregulation of LIFR-AS1
(a) LIFR-AS1 levels in 139 pairs of PC tissues and adjacent normal tissues were quantified via qRT-PCR. *P < 0.05 vs. adjacent normal. (b) Expression of LIFR-AS1 was quantified in the AsPC-1, BxPC-3, Mia-capa2, HPAC, and PANC-1 PC cell lines and in the control HPDE cell line via qRT-PCR. *P < 0.05 vs. HPDE. *P < 0.05; **P < 0.01; ***P < 0.001; P > 0.05.
