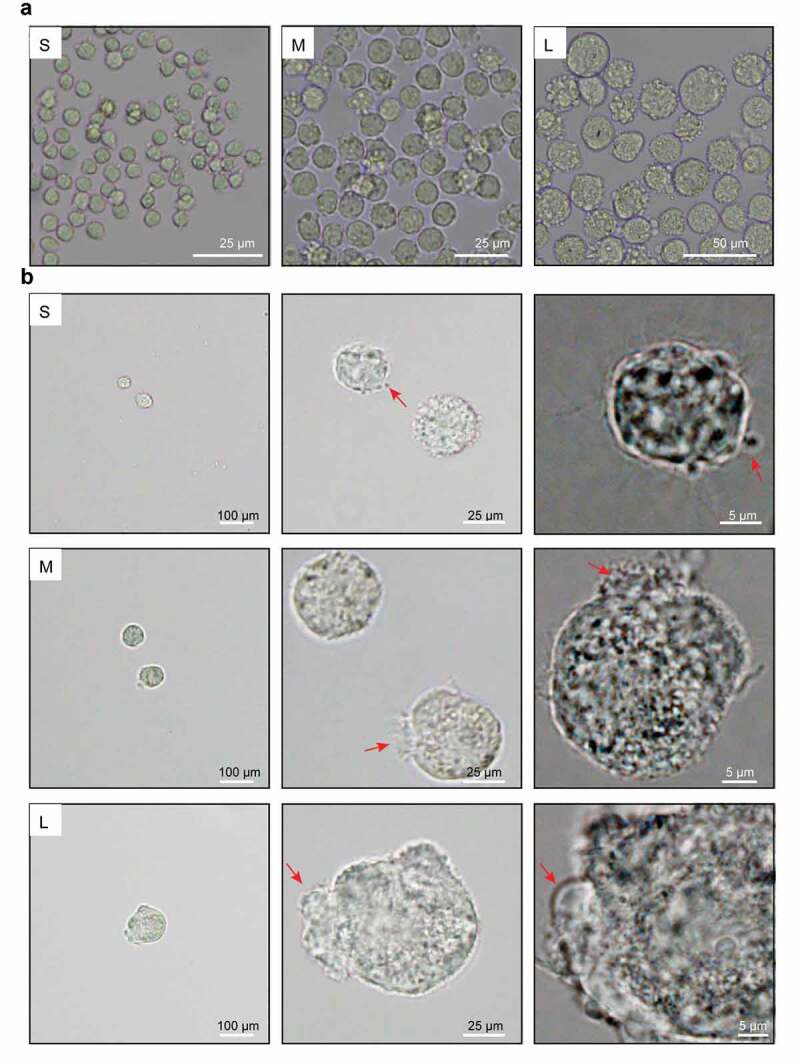
Figure 3.

Microscopic assessment of cell membrane morphology of PFFs of different sizes. A. The different degrees of cell membrane roughness of small (s), medium (m) and large (l) cells as assessed by microscopy. B. The cell membrane of small (S), medium (M) and large (L) cells under 10×, 40× and 100× microscopy. The red arrows represent irregular parts of cells
