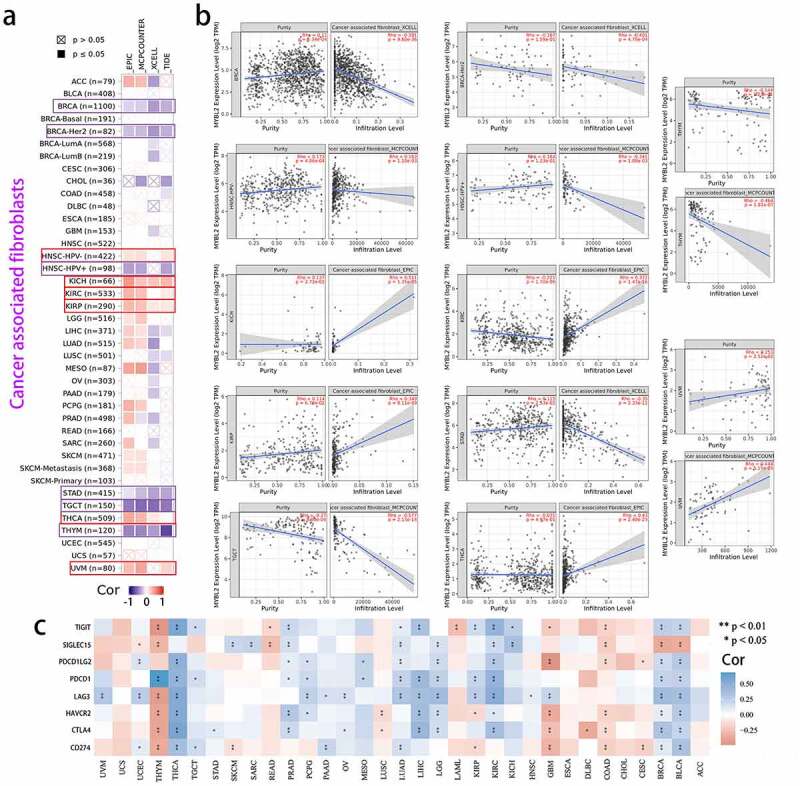
Figure 5.

Correlation analysis between MYBL2 expression and cancer-related immune cells. The potential correlation between the expression level of the MYBL2 gene and the infiltration level of cancer-associated fibroblasts based on different algorithms across all types of cancer in the TCGA analyzed by TIMER2.0. Correlation heat maps (a) and some of the correlation curves (b). (c) Heat maps showing the correlations between MYBL2 expression level and the immune checkpoint-related genes SIGLEC15, IDO1, CD274, HAVCR2, PDCD1, CTLA4, LAG3 and PDCD1LG2 plotted with the R language
