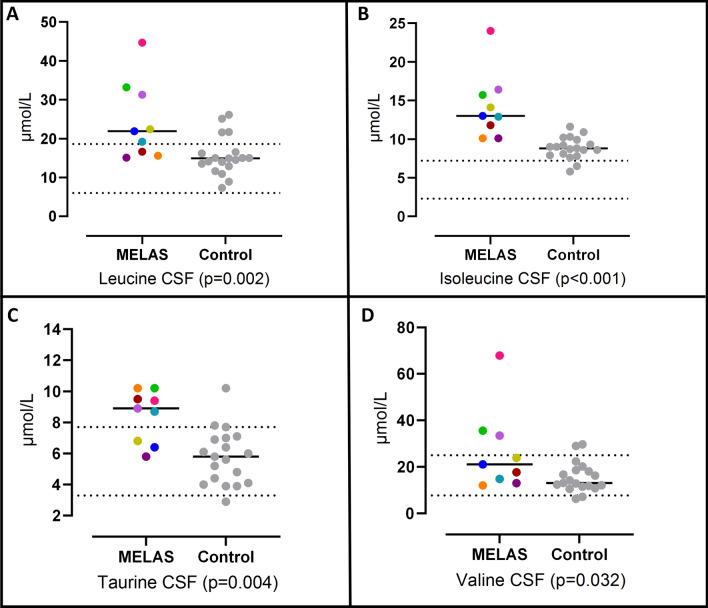
Fig. 2.
CSF levels of leucine (A), isoleucine (B), taurine (C) and Valine (D) in MELAS patients and controls. Colored symbols correspond to individual subjects according to Table 1. Horizontal lines represent mean values for each group. Statistical significances were assessed by Mann–Whitney U tests. Parallel dotted lines correspond to our laboratory reference ranges in healthy adults

