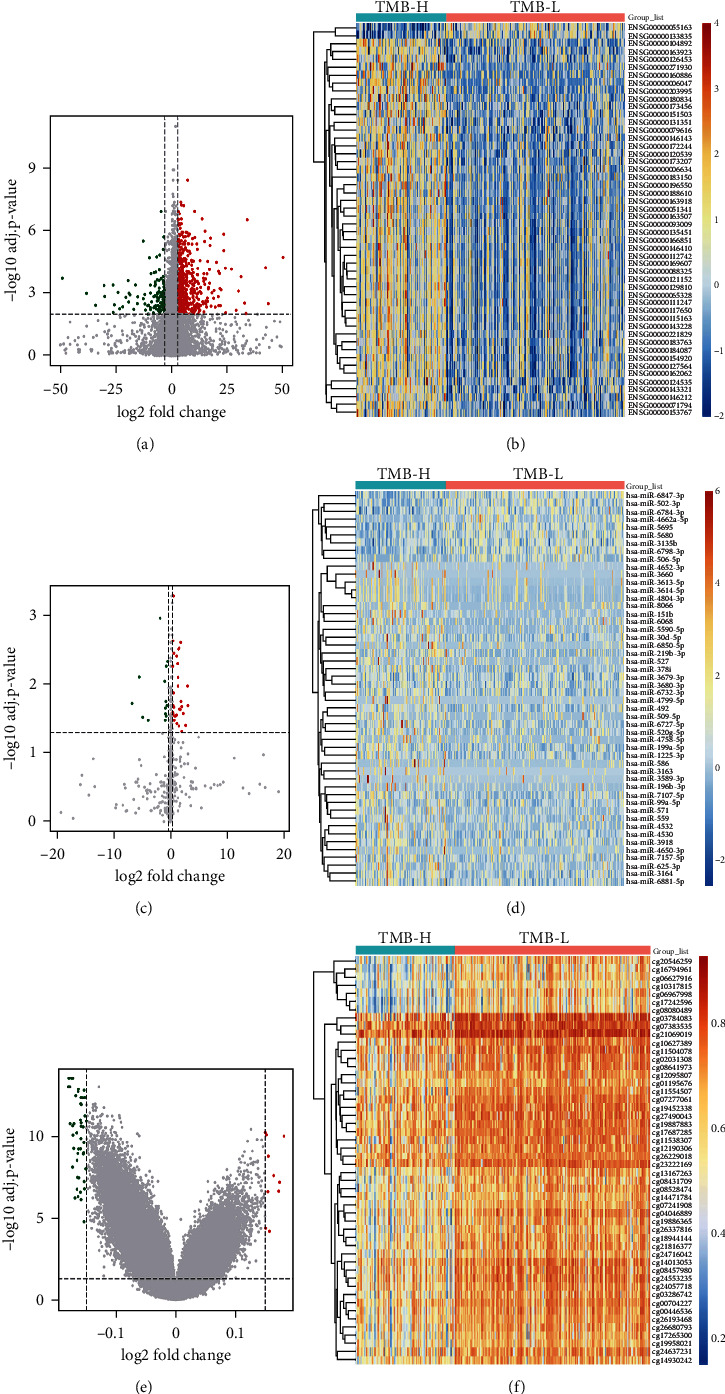
Figure 5.

Characterization of the top50 differential expressed genes, miRNAs, and differential methylated CpG sites between TMB-H and TMB-L patients. Volcano plot showed the differentially expressed genes (a) and miRNAs (c) or differentially methylated CpG sites (e) between TMB-H and TMB-L patients. The red dots represent upregulated genes, miRNAs, or hypermethylated CpG sites; the blue dots represent downregulated genes, miRNAs, or hypomethylated CpG sites; the black dots represent genes, miRNAs, or CpG sites with no significantly differential expression or methylation. Hierarchical clustering heatmap of differentially expressed genes (b) and miRNAs (d) or differentially methylated CpG sites (f) between TMB-H and TMB-L patients. Orange indicates the upregulated genes, miRNAs, or hypermethylated CpG sites; blue indicates the downregulated genes, miRNAs, or hypomethylated CpG sites. TMB-H: TMB-high; TMB-L: TMB-low.
