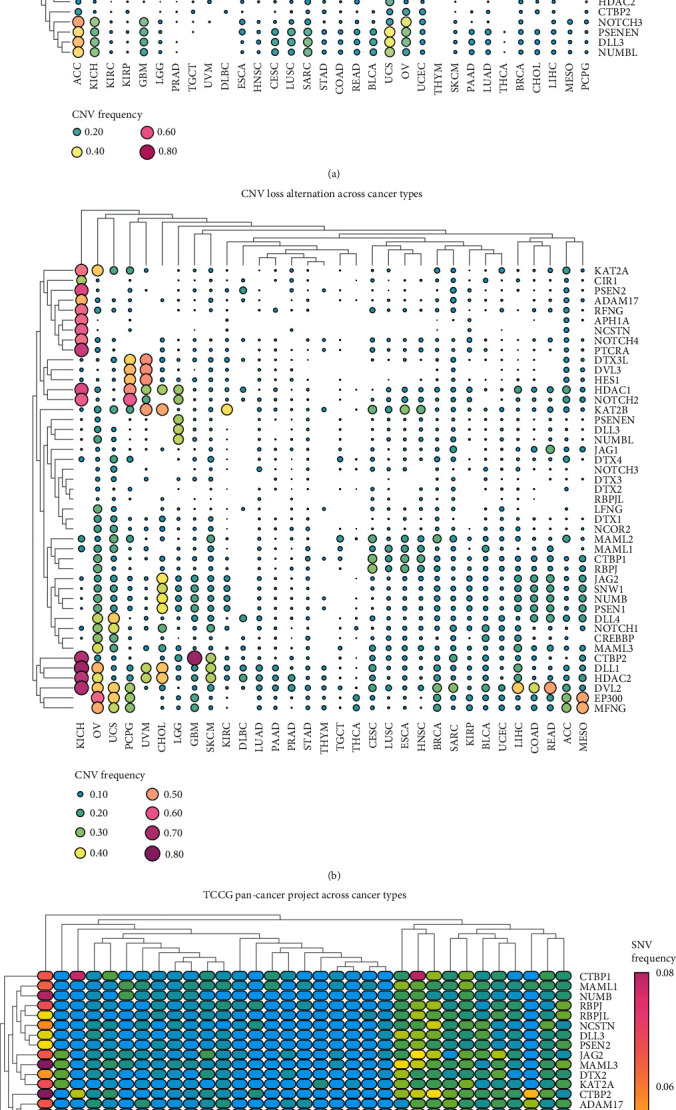
Figure 1.

(a, b) CNV frequencies of 47 Notch pathway genes in 32 tumor types from TCGA. The color bar on the right represents gain or copy number, with pink representing high copy frequency and green representing low copy frequency. (c) SNV frequencies of 47 Notch pathway genes. The color bar on the right shows the degree of SNV, with pink representing high frequency and blue representing low frequency.
