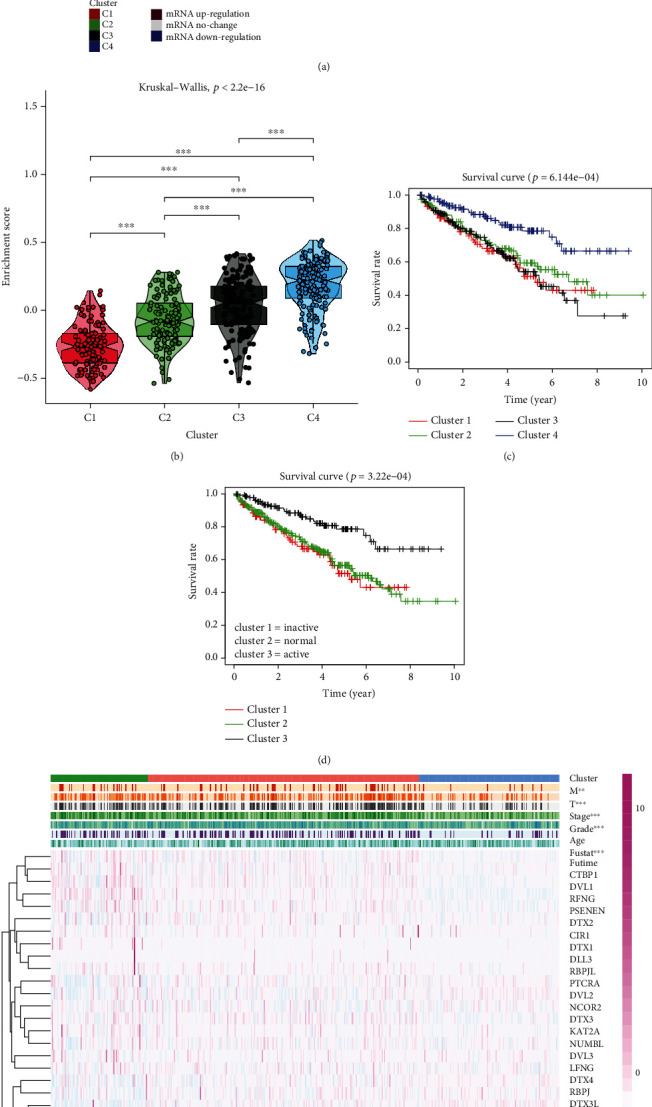
Figure 3.

(a) Notch pathway genes were divided into 4 clusters. According to the Notch-score, cluster 1 (red), cluster 2 (black), cluster 3 (green), and cluster 4 (Blue) were ranked from lowest to highest. (b) Violin plot shows the enrichment score of 4 clusters. (c, d) Survival curves of four clusters. Since the distinction is not clear, we merge clusters 2 and 3. The survival curve of the three clusters is shown in the plot. (e) Heatmap of the correlation between the Notch-score and the clinicopathological characteristics (∗p < 0.05, ∗∗p < 0.01, ∗∗∗p < 0.001).
