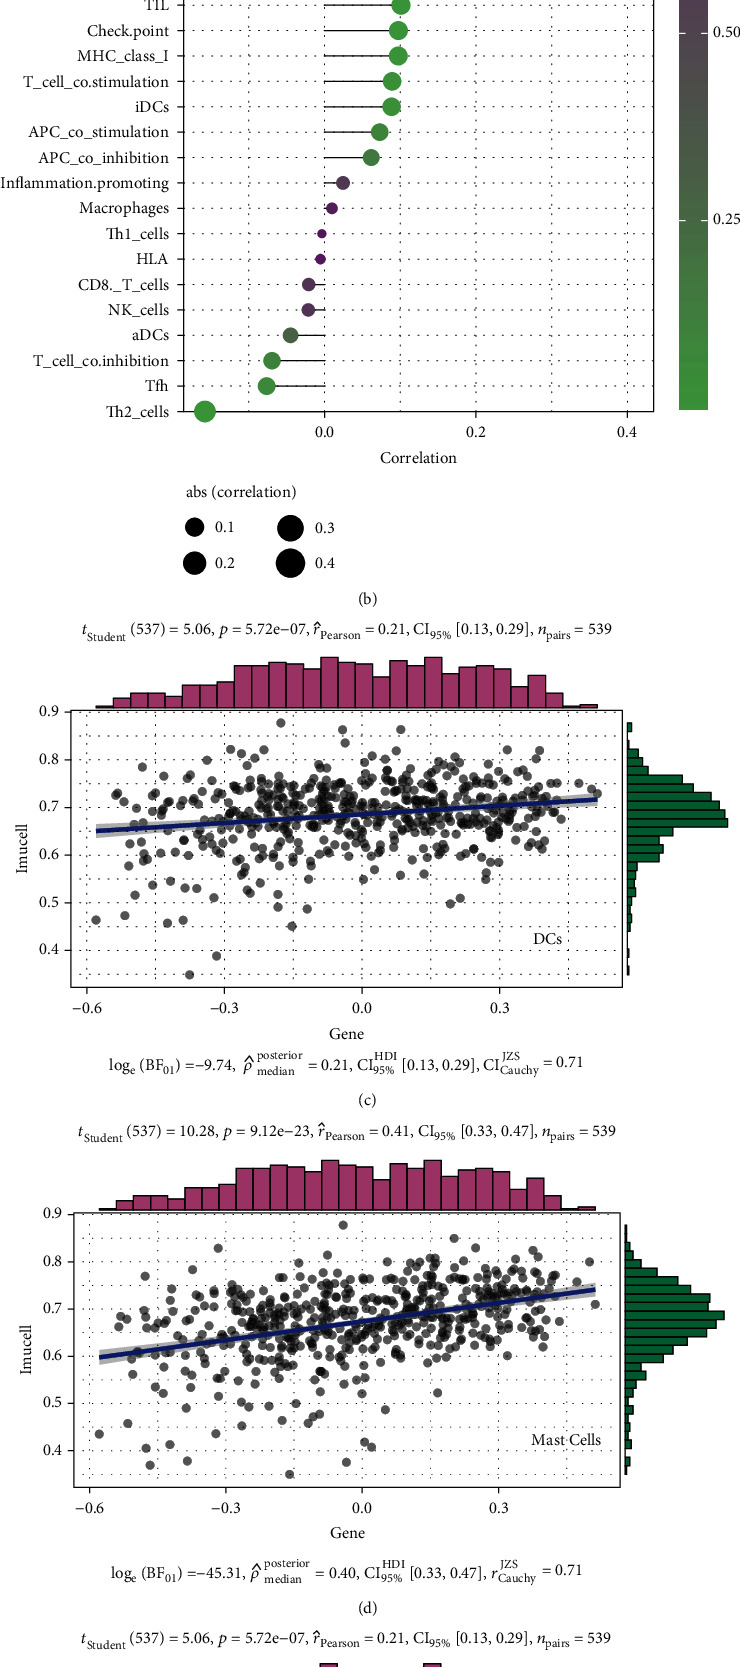
Figure 6.

(a) Heatmap showing the correlation between Notch pathway genes and immune-infiltrating agents. Pink represents positive, and blue represents negative (∗p < 0.05, ∗∗p < 0.01). (b) In the plot depicting the degree of correlation, the area of the sphere represents the abs (correlation) and the color represents the p value. (c–f) The scatter plot depicting the specific relationship between four immune infiltration-related agents and the Notch-score, and it can be seen from the figure that they are all positively correlated.
