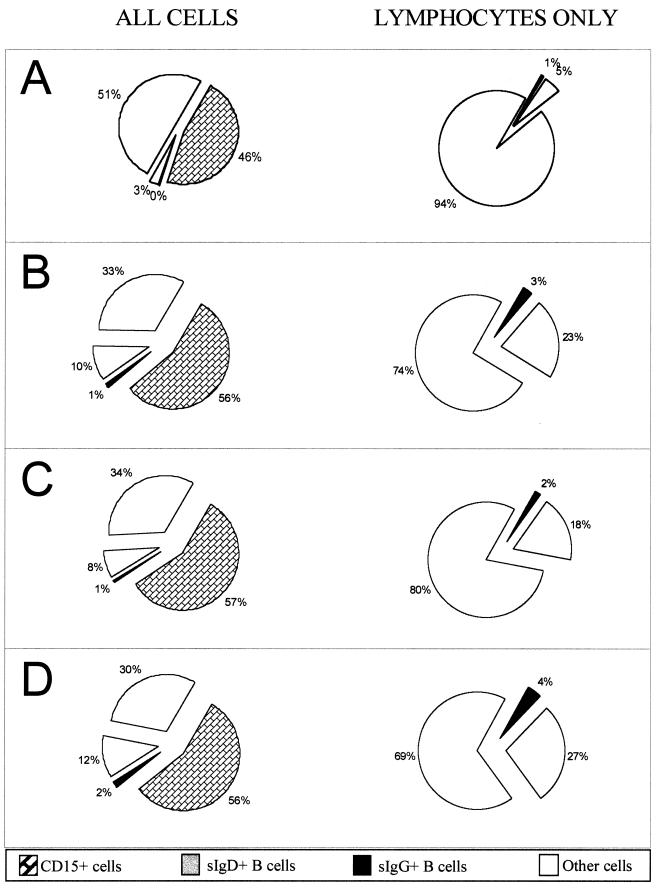
FIG. 6.
Pictographs showing the relative proportions of B cells in the population of cells purified from the blood of immunosuppressed transplant recipients. On the left are the percentages of B cells in the total population, while on the right the CD15+ cells have been removed and only lymphocytes have been considered. (A) Control EBV-negative pediatric transplant recipients; (B) mean of all 19 chronic load carriers in the study group; (C) the 10 chronic low-load carriers; (D) the 9 chronic high-load carriers.

