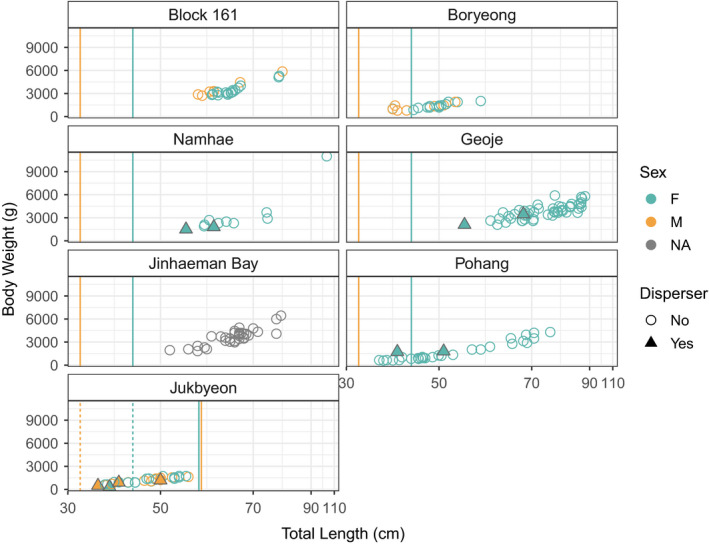
FIGURE 2.

Distributions of sex‐specific total length versus body weight at each sampling site. Both sampling years for Geoje are included, but only the early spawning fish from Jinhaeman Bay (Dec. 2007 collection) were measured. Sex data were not available for Jinhaeman Bay samples. Solid vertical lines indicate the appropriate sex‐specific 50% length‐at‐maturity estimate for the East Sea or the Yellow Sea / southern coast. Triangle data points indicate putative dispersers, which are shown by the spawning site where they were sampled. At Jukbyeon, the 50% length‐at‐maturity estimate for the immigrants’ source population (western and southern coasts) differed from the estimate at that site, and so the 50% length‐at‐maturity estimate for the putative source population is depicted with dashed vertical lines
