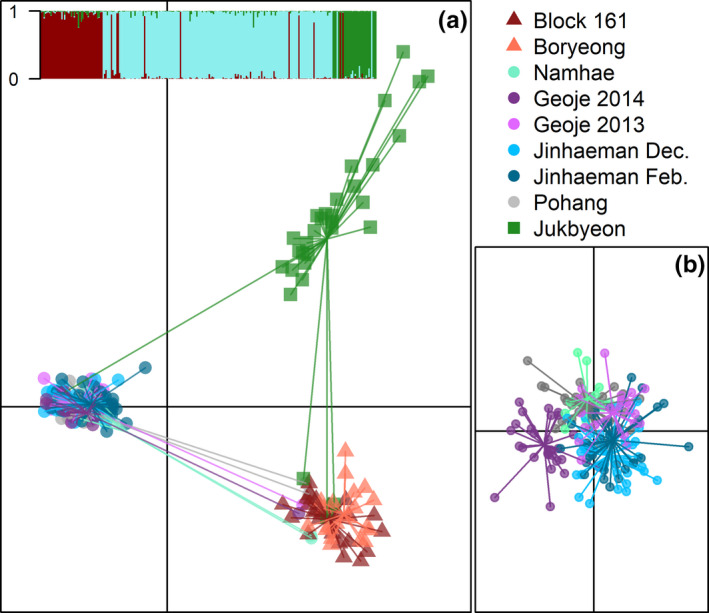
FIGURE 3.

Principal component analysis of all samples (a) and discriminant analysis of principal components for southern samples only (b). The first and second principal components of the principal component analysis (PCA) explained 3.09% and 1.65% of the variation in the data. Inset (a) shows proportion of membership to the western (red), southern (blue), and eastern (green) coast populations according to Structure for each individual, ordered by collection from west to east. Note that individuals which cluster with a different population in the principal component analysis display a majority membership in a different population than their neighbors in the Structure inset
