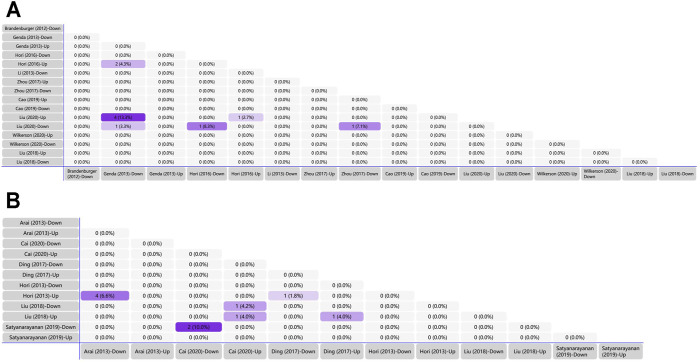
FIGURE 2.
Tabular Venn diagram analysis. (A) Matrix table analysis for miRNAs expression profiles in spinal cord of NP surgical models. The number and percentage of co-regulated miRNAs were highlighted. Overlapping miRNAs: 2 (4.3%): miR-21, miR-27b; 4 (13.3%): miR-22, miR-377, miR-7a, miR-21; 1 (3.3%): miR-365; 1 (8.3%): miR-214; 1 (2.7%): miR-21; 1 (7.1%): miR-184. (B) Matrix table analysis for miRNAs expression profiles in brain of NP surgical models. The number and percentage of co-regulated miRNAs were highlighted. Overlapping miRNAs: 4 (6.6%): miR-132, miR-151-3p, miR-186, miR-204; 2 (10.0%): miR-200b-3p, miR-182; 1 (4.2%): miR-370-5p; 1 (4.0%) left: miR-873-5p; 1 (4.0%) right: miR-205; 1 (1.8%): miR-539.

