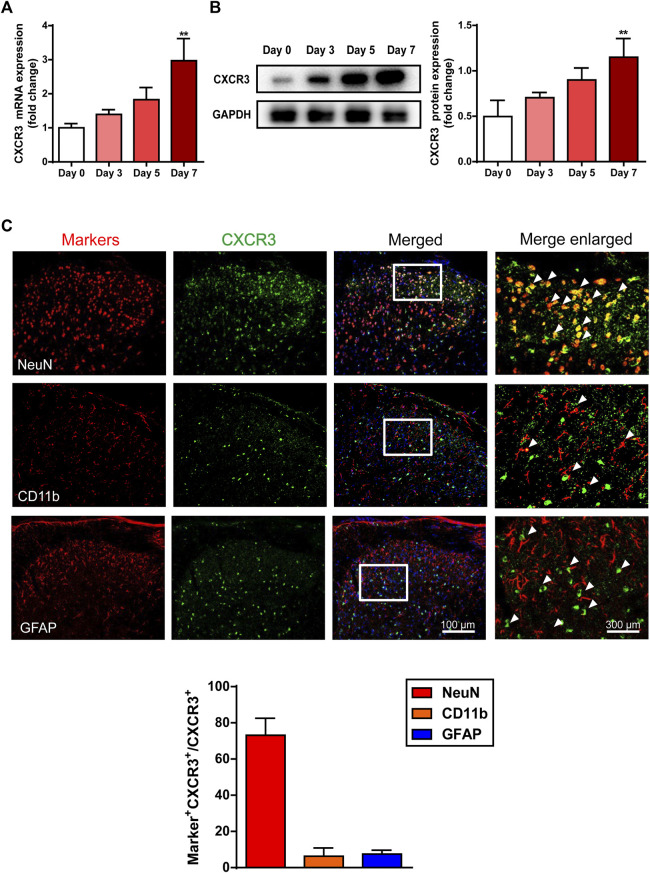
FIGURE 5.
The expression profile of CXCR3 in the spinal cord in the AEW-stimulated mice. The mRNA (A) and protein (B) level of CXCR3 in the spinal cord increased as stimulation of AEW went on (n = 3–7 each group). (C) Immunofluorescence co-staining images of CXCR3 with neuron marker (NeuN), microglial marker (CD11b) and astrocyte marker (GFAP) in the spinal dorsal horn of AEW mice (n = 4 each group). Data were expressed as mean ± SEM. ∗∗ p < 0.01, compared to the Day 0 group.

