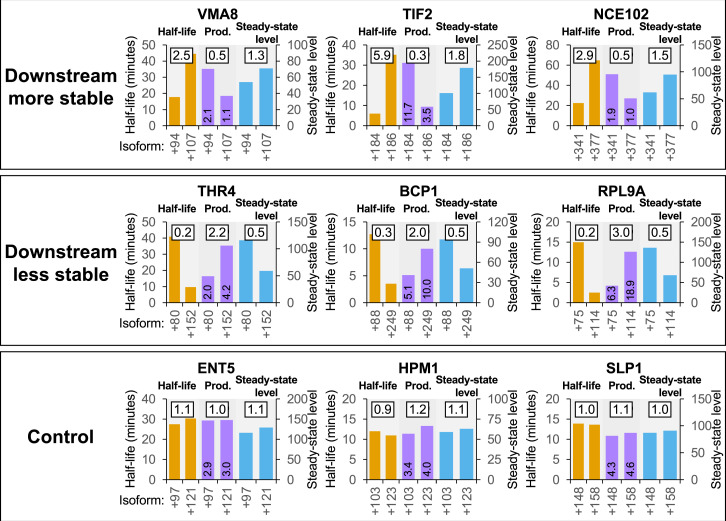
Fig. 1.
Examples from a published dataset (10) showing compensation between cleavage/polyadenylation and mRNA stability in YPD medium. For each gene, the most- and least-stable isoforms are compared with respect to isoform stability (orange bars, values on left y axis), relative production rate (purple bars, values printed on the bars), and steady-state level (blue bars, values on right y axis). Three examples are shown for each of the “downstream less stable,” “downstream more stable,” and “control” 3′UTR categories. The boxed number above each pair of bars gives the ratio of values for the two isoforms (always expressed as downstream/upstream).

