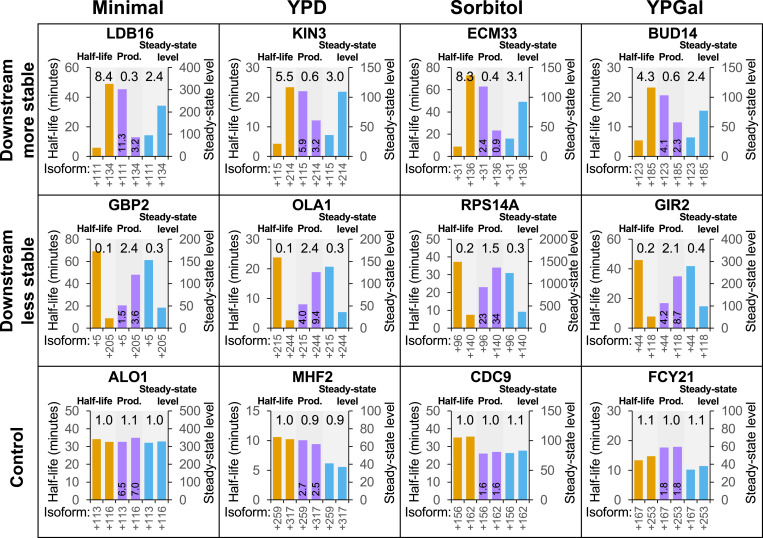
Fig. 3.
Examples showing compensation between cleavage/polyadenylation and mRNA stability in Minimal, YPD, Sorbitol, and YPGal media. For each gene, the most- and least-stable isoforms are compared with respect to stability (orange bars, values on left y axis), relative production rate (purple bars, values printed on bars), and steady-state expression level (blue bars, values on right y axis). Examples are shown for each of the “downstream less stable,” “downstream more stable,” and “control” categories for every growth condition. Ratios (numbers above the bars for each isoform pair) are expressed as downstream/upstream isoform values.

