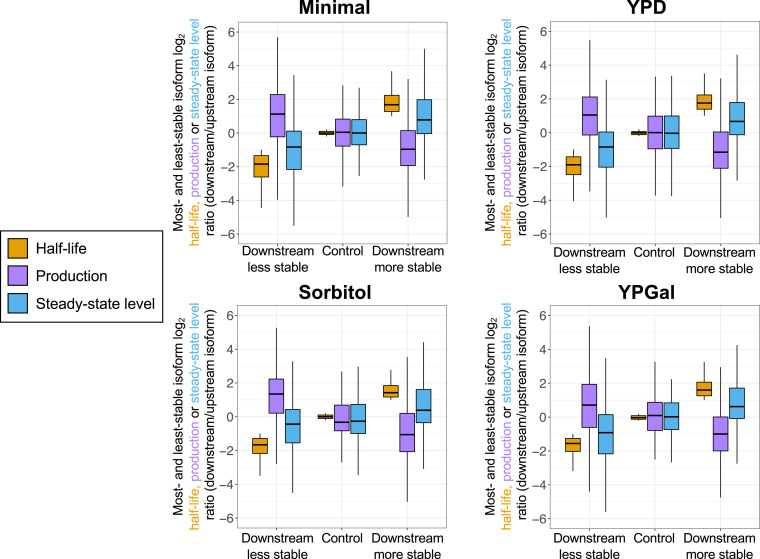
Fig. 4.
Median production and stability ratios for most- and least- stable same-gene isoforms are inversely related in Minimal, YPD, Sorbitol, and YPGal media. Three classes of most- and least-stable same-gene isoform pairs are considered, based on whether the downstream isoform is more stable, less stable, or comparably stable to the upstream isoform. For each group, distributions of relative production rate ratios (purple boxes) and relative steady-state ratios (at t = 0; blue boxes) are shown alongside the half-life distributions of the same isoforms (gold boxes). Ratios are plotted as log2 downstream/upstream isoform values. Data (10, 30) (GEO accession no. GSE191091) are tabulated in SI Appendix.

