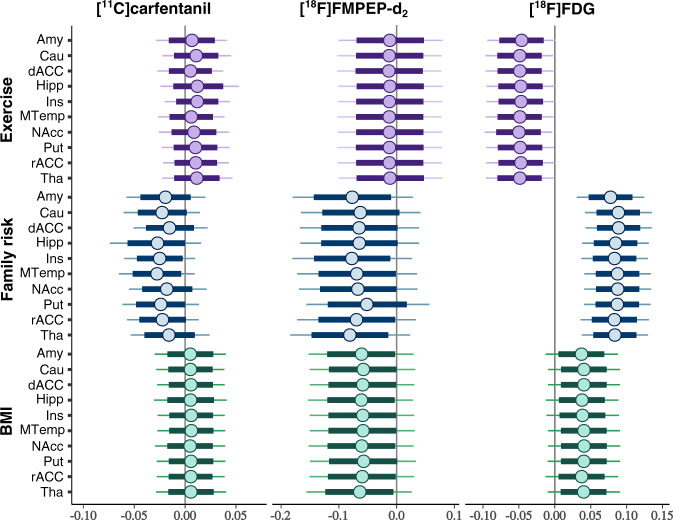
Fig. 3. Effects of obesity risk factors on brain glucose uptake and neuroreceptor availability in ten representative regions of interest.
Posterior distributions of the regression coefficients for exercise, family risk and body mass index (BMI) on log-transformed binding potential (BPND) of the [11C]carfentanil, volume of distribution (VT) of the [18F]FMPEP-d2 and brain glucose uptake (BGU) quantified with [18F]FDG in representative regions of interest, age as a covariate. The colored circles represent posterior means, the thick horizontal bars 80% posterior intervals, and the thin horizontal bars 95% posterior intervals. The width of posterior intervals illustrates the level of uncertainty of the estimate. Abbreviations: Amy = amygdala, Cau = caudate, dACC = dorsal anterior cingulate cortex, Hipp = hippocampus, Ins = insula, MTemp = middle temporal gyrus, NAcc = nucleus accumbens, Put = putamen, rACC = rostral anterior cingulate cortex, Tha = thalamus.

