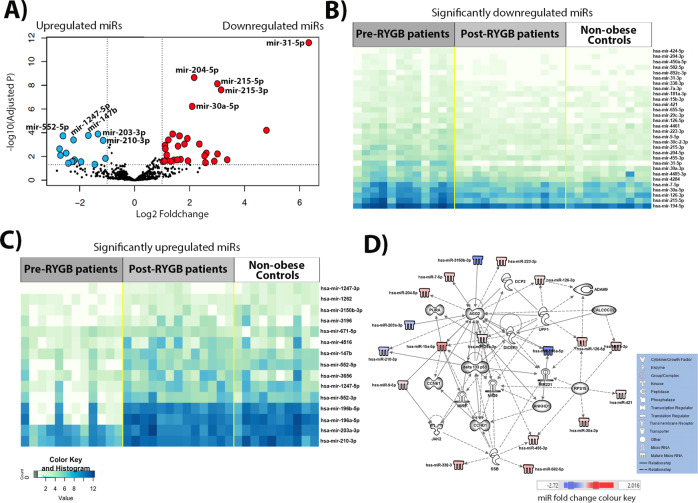
Fig. 2. Differential miRNA expression in obese individuals pre- compared with post-RYGB, identified by NGS.
A Volcano plot illustrating 30 significantly upregulated miRNAs (red dots, top 5 miRNAs are annotated: miR-31-5p, miR-215-3p, miR-215-5p, miR-30a-5p and miR-204-5p) and 15 downregulated miRNAs (blue dots, top five are annotated: miR-200-3p, miR-203-3p, miR-147b, miR-1247-5p and miR-552-5p) with fold change >1. B Heatmap of significantly up-regulated miRNAs, for which expression differed significantly between the obese individuals pre- and post-RYGB. C Heatmap of significantly downregulated miRNAs, for which expression differed significantly between the obese individuals pre- and post-RYGB. D IPA network of miRNAs for which expression differed by logFC >1 in the pre- and post-RYGB and their predicted target molecules.

